How Much Does Solar Panel Installation Cost in 2026?
By 2026, the global solar panel installation cost is projected to average between USD 0.85 and 1.10 per watt for utility-scale projects, with residential systems typically ranging from USD 1.30 to 2.00 per watt depending on region and policy support. This steady decline from earlier years reflects advances in cell efficiency, automation in manufacturing, and resilient supply chains. Government incentives remain a major driver in keeping solar energy affordable for both households and large-scale investors.
Overview of Global Solar Panel Installation Costs in 2026
The solar industry’s pricing structure continues to evolve as technology matures and markets expand. While the overall trend points downward, regional differences and policy shifts still create a wide range of outcomes across continents.
Key Factors Influencing Installation Costs Worldwide
Technological progress plays a central role in shaping solar panel installation cost trends. Improvements in photovoltaic (PV) efficiency reduce material use per watt, while streamlined manufacturing processes cut down production time. Supply chain stability has also improved since the disruptions of the early 2020s, allowing more predictable pricing for components like silicon wafers and glass modules. In parallel, government incentives—such as tax credits or feed-in tariffs—continue to define the financial feasibility of new installations by offsetting initial capital expenditure.
Regional Variability in Solar Energy Markets
Regional disparities stem largely from differences in labor costs, permitting frameworks, and infrastructure readiness. Countries with established renewable sectors benefit from competitive contractor markets that drive prices lower. Currency fluctuations further complicate international project budgeting; a strong dollar or euro can make imported components more expensive for emerging economies. Market maturity also matters: where competition among installers is intense, consumers enjoy lower per-watt costs due to efficiency gains and bulk purchasing power.
Cost Analysis by Major Global Regions
Regional cost dynamics reveal how national policies and market development stages influence total system expenses.
North America: Market Dynamics and Pricing Trends
In the United States, average solar panel installation cost hovers near USD 1.40 per watt for residential systems by 2026, while Canada maintains slightly higher averages due to colder climate requirements and smaller market scale. Federal tax credits under programs like the Investment Tax Credit (ITC) remain key in reducing upfront expenses by up to 30%. Labor costs remain one of the largest contributors to total system price, alongside local permitting fees that vary widely across states. Integration challenges with aging grid infrastructure also add complexity to project timelines.
Europe: Policy-Driven Price Adjustments
Europe’s solar pricing landscape is heavily shaped by policy harmonization under the EU Green Deal framework. Western European nations such as Germany and Spain continue to lead with sub-USD 1 per watt utility-scale installations due to mature supply chains and domestic production capacity. Eastern European markets are catching up but face higher financing costs and limited installer competition. The EU’s commitment to local manufacturing has helped stabilize equipment prices by reducing reliance on imported modules from Asia.
Asia-Pacific: Rapid Growth and Economies of Scale
Asia-Pacific remains the world’s largest solar market by volume. China’s dominance in module production keeps global benchmark prices low, often below USD 0.90 per watt for large projects. India benefits from government-backed subsidies that encourage rooftop adoption despite high import tariffs on foreign components. Japan’s focus on high-efficiency modules sustains premium pricing, while Australia’s competitive retail market drives down residential installation costs through volume deployment.
Latin America and Africa: Emerging Market Perspectives
In Latin America and Africa, logistics challenges and import duties significantly affect final installation prices. Transporting panels over long distances or through ports with limited capacity can raise project budgets by up to 15%. Access to affordable financing remains a barrier for many developers despite abundant sunlight resources. However, international partnerships—especially those involving multilateral development banks—are opening new avenues for cost reduction through shared risk models.
Technological Innovations Affecting 2026 Pricing Models
Innovation continues to redefine what determines solar panel installation cost beyond raw materials or labor inputs.
Advances in Photovoltaic Efficiency and Manufacturing Processes
Next-generation cell technologies such as heterojunction (HJT) and tandem perovskite-silicon structures are pushing conversion efficiencies above 25%, reducing total module area required per system size. Automation throughout assembly lines minimizes manual labor needs during both production and field installation phases. Recycling initiatives are also gaining traction as manufacturers reclaim valuable materials like silver paste or glass from decommissioned panels, improving lifecycle economics.
Integration with Energy Storage Systems
Solar-plus-storage packages are increasingly priced together rather than separately quoted components. Declining lithium-ion battery prices—expected around USD 100 per kWh by mid-decade—make combined systems more attractive for grid resilience applications. As storage technology improves cycle life and charge efficiency, total system ROI improves even when initial investment appears higher than standalone PV setups.
Economic and Policy Drivers Shaping Future Cost Trends
Beyond technology itself, macroeconomic conditions and regulatory frameworks will determine whether costs continue their downward trajectory after 2026.
Global Supply Chain Resilience Post-Energy Transition Challenges
After earlier disruptions caused by pandemics or geopolitical tensions, manufacturers have diversified sourcing strategies across multiple continents to mitigate risks tied to single-region dependencies. This diversification helps stabilize component availability while smoothing price volatility during demand surges.
Regulatory Frameworks Encouraging Competitive Pricing Models
Reforms in net metering policies directly affect adoption rates by defining how excess power generation is credited back to users’ bills. Similarly, carbon pricing mechanisms indirectly influence installation economics by making fossil-based generation comparatively less attractive financially.
Comparative Assessment of Residential, Commercial, and Utility Segments in 2026
Each market segment faces distinct cost pressures tied to scale, financing terms, and design complexity.
Residential Installations: Affordability and Payback Periods
Typical residential systems range between 5–10 kW capacity with installed costs averaging USD 1.50–2.00 per watt globally in 2026. Payback periods vary from six years in subsidy-rich regions like California or Germany to over ten years where incentives are limited or electricity tariffs remain low.
Commercial Projects: Scaling Effects on Per-Watt Costs
Commercial installations benefit from economies of scale that reduce hardware markups compared with small household systems. Large rooftops or parking canopy arrays often achieve sub-USD 1 per watt rates while supporting corporate sustainability targets that justify capital allocation toward renewables.
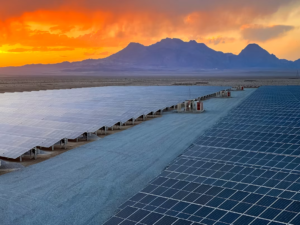
Utility-Level Installations: Infrastructure Investment Considerations
Utility-scale solar farms require extensive land acquisition planning and grid interconnection coordination which can account for nearly one-fifth of total project expenditure. Financial modeling increasingly incorporates long-term maintenance contracts ensuring predictable returns under evolving energy market conditions through power purchase agreements (PPAs).
Forecasting Long-Term Cost Trajectories Beyond 2026
Looking past immediate forecasts reveals how innovation cycles will sustain affordability well into the next decade.
Expected Price Reductions Through Innovation Cycles
Further breakthroughs in cell architecture could push module efficiencies toward theoretical limits above 28%, lowering effective cost per watt even without major raw material savings. Digital monitoring tools using AI-driven diagnostics are expected to trim operational expenditures by automating fault detection across distributed assets.
Global Investment Patterns Supporting Continued Cost Decline
Institutional investors are channeling growing capital flows into renewable infrastructure funds seeking stable yields amid decarbonization mandates worldwide. Cross-border collaborations between developed markets and emerging economies will accelerate convergence toward global price parity as financing mechanisms mature.
FAQ
Q1: What is the average global solar panel installation cost in 2026?
A: It ranges roughly between USD 0.85–1.10 per watt for large projects and up to USD 2 per watt for residential setups depending on region.
Q2: Which region offers the lowest installation prices?
A: Asia-Pacific leads globally due to China’s manufacturing scale that keeps module prices at record lows.
Q3: How do government incentives impact overall costs?
A: Incentives like tax credits or rebates reduce upfront capital requirements significantly improving project payback times.
Q4: Are integrated storage systems becoming standard?
A: Yes, falling battery prices make combined solar-plus-storage systems increasingly common for both homes and utilities.
Q5: What factors could raise future costs despite innovation?
A: Persistent supply chain bottlenecks or currency instability could temporarily slow price declines even amid technological progress.