
Clean power energy is now a market-shaping force
Clean power energy is best understood as electricity produced with low or near-zero operational emissions. In most market discussions, that mainly includes renewables such as solar, wind, hydropower, geothermal and bioenergy. Many analyses also include nuclear power because it produces low-emissions electricity at the point of generation. The important change is not simply that clean electricity is growing. It is now large enough to influence fossil generation, grid planning, power prices, industrial strategy and energy security at the same time.
Public data released in 2026 shows why the shift matters. The International Energy Agency reported that growth in renewables and nuclear exceeded the entire global increase in electricity generation in 2025. The International Renewable Energy Agency reported that renewable power capacity reached 5,149 GW after 692 GW of additions in 2025. For readers tracking the wider transition, this makes clean energy less of a future target and more of a current electricity-market reality.
What changed in 2025
The clean power story in 2025 was not defined by a single technology or country. It was defined by scale. According to IRENA’s Renewable Capacity Statistics 2026, renewables accounted for 85.6% of global net power capacity expansion in 2025. Solar led the additions, with about 511 GW of new solar capacity, roughly three quarters of the renewable total. Wind remained the second major pillar. Hydropower, bioenergy, geothermal and marine energy made up smaller shares of new capacity.
Generation data tells a related but different story. Capacity measures what power plants can produce under suitable conditions. Generation measures the electricity actually delivered. The IEA’s Global Energy Review 2026 said renewables supplied 34% of global electricity in 2025, up from 32% in 2024 and 23% a decade earlier. That increase matters because electricity demand also kept rising. Data centres, electrification, cooling demand, industrial activity and population growth all added pressure to power systems.
Ember’s Global Electricity Review 2026 added another milestone: renewables overtook coal in the global power mix in 2025, with renewables at about 33.8% and coal at about 33.0% of generation. Different institutions classify clean and renewable power in slightly different ways, but the direction is consistent across major datasets. Solar and wind are no longer marginal additions to a fossil-based system. They are among the main sources meeting new electricity demand.
The technologies driving clean power growth
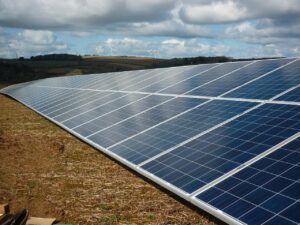
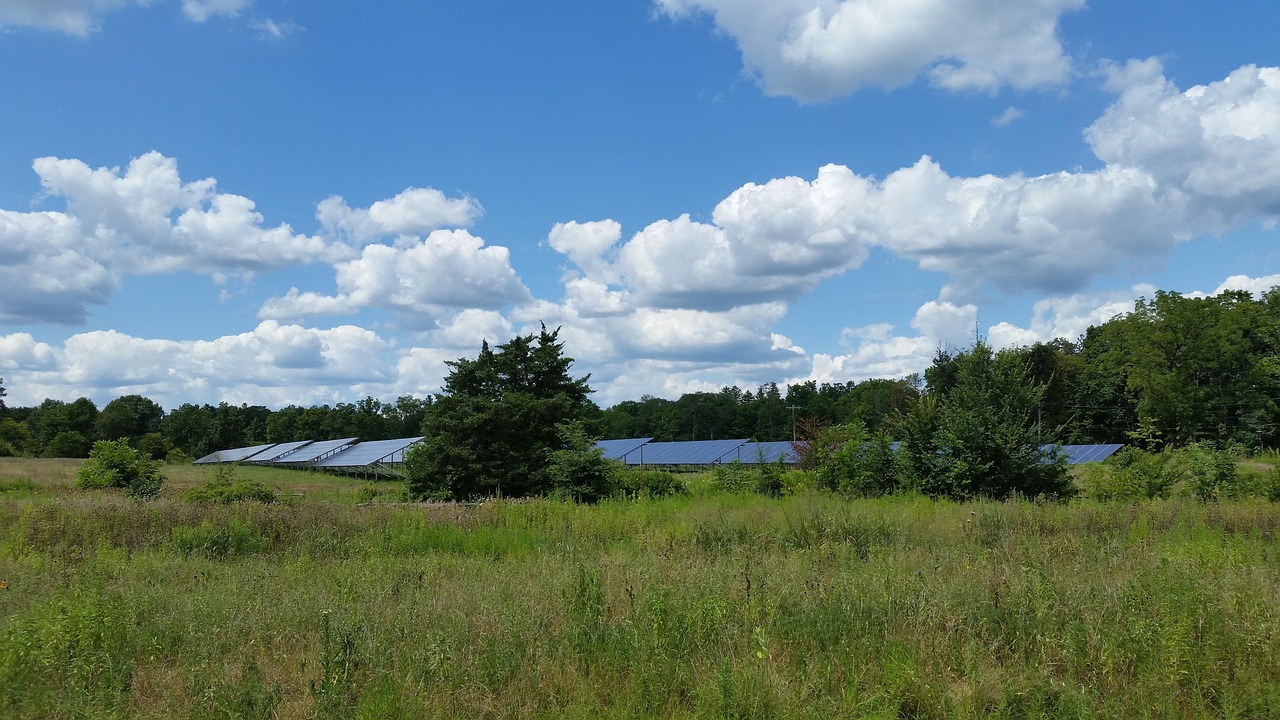
Solar PV is the leading driver of clean power energy growth because it is modular, fast to build, widely deployable and supported by a mature global supply chain. The IEA estimated that solar PV generation increased by about 600 TWh in 2025, one of the largest one-year increases ever recorded for any electricity source outside unusual post-crisis rebounds. IRENA’s capacity data points in the same direction from the installation side, with solar accounting for most new renewable capacity in 2025.
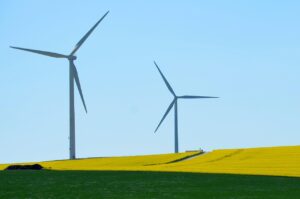
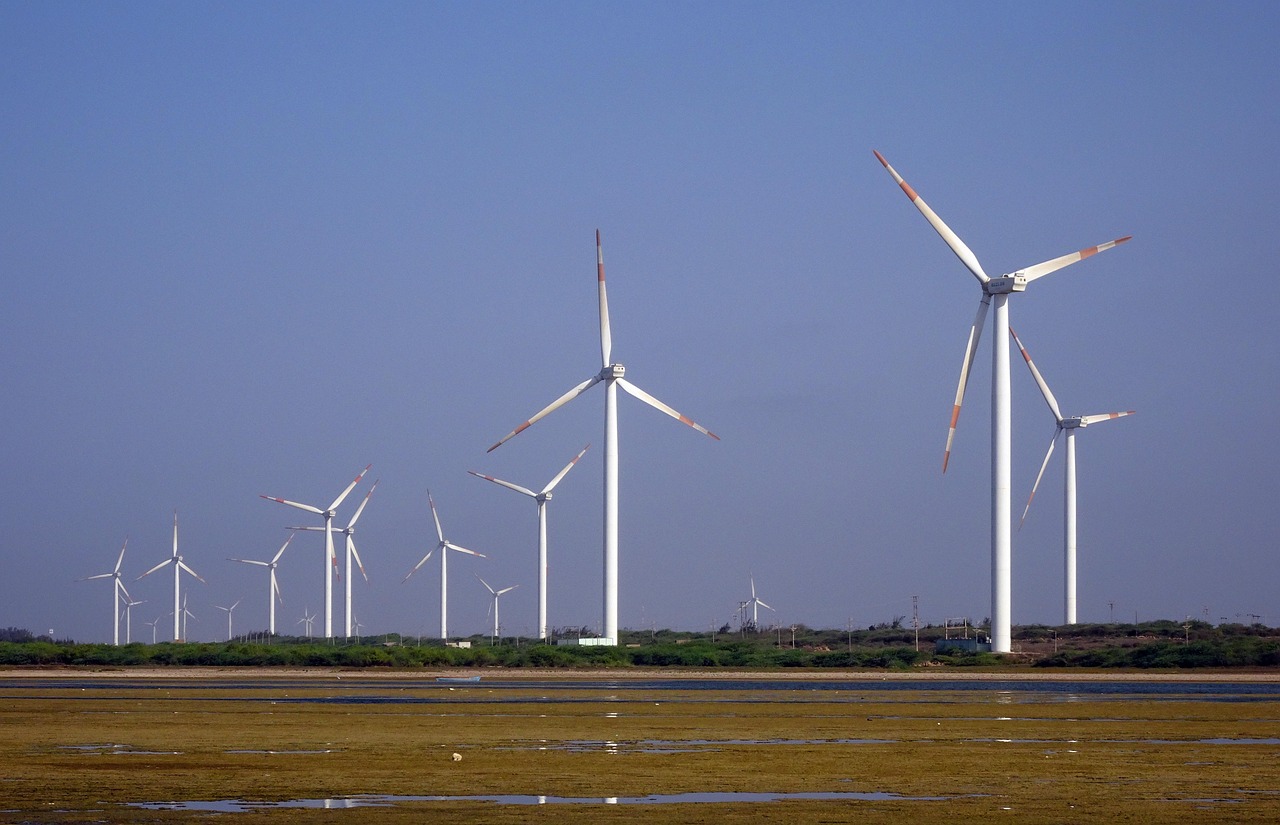
Wind power remains essential because it often produces during different hours and seasons than solar. Onshore wind is generally faster to deploy than offshore wind. Offshore wind can deliver high output near coastal demand centres, but it faces higher financing, permitting and supply-chain complexity. Hydropower still provides large volumes of low-carbon electricity and flexibility in many regions, although drought risk and environmental limits restrict how much new large hydro can expand.
Nuclear power is treated differently across clean-energy discussions. It is not renewable, but it is low-emissions at the point of generation and provides firm electricity that can complement weather-dependent renewables. The IEA includes nuclear in its low-emissions power analysis and reported that nuclear generation expanded in 2025. For power systems, the practical question is not whether every clean technology is identical. It is how different resources combine to deliver reliable, affordable and lower-emission electricity.
| Technology | Main role in clean power energy | Key limitation |
|---|---|---|
| Solar PV | Fast capacity growth, daytime generation and falling deployment times | Output varies by weather and time of day |
| Wind | Large-scale renewable generation across onshore and offshore sites | Permitting, grid access and supply-chain delays |
| Hydropower | Dispatchable renewable generation and storage in some systems | Geography, drought exposure and ecological constraints |
| Nuclear | Firm low-emissions electricity where plants are operating or built | High capital cost, long project timelines and policy debate |
| Battery storage | Shifts solar and wind output to higher-value hours | Duration, mineral supply chains and revenue certainty |
Why clean power energy changes electricity markets
The first market effect is on the merit order. Solar and wind have low operating costs once built, so they can reduce wholesale prices during high-output hours. That helps consumers and industries that can shift demand. It can also put revenue pressure on generators when grids have more clean electricity than they can absorb at certain times. As a result, flexibility becomes more valuable.
Flexibility can come from batteries, pumped hydro, interconnectors, demand response, flexible industrial loads, smarter electric-vehicle charging and market rules that reward fast response. Without flexibility, high renewable penetration can lead to curtailment, where available clean electricity is not used because the grid cannot move or balance it. Curtailment is not a reason to stop building clean power. It is a signal that transmission, storage and market design need to catch up.
The second effect is on fuel security. Clean power energy reduces exposure to imported coal, oil and gas for electricity generation. It does not remove all energy-security risks, because clean energy supply chains depend on critical minerals, manufacturing capacity, grid equipment and project finance. The risk profile changes. Instead of buying fuel continuously, countries invest more upfront in generation assets, networks and storage that can operate for decades.
The third effect is on industrial competitiveness. Regions with abundant clean electricity can attract data centres, battery factories, green hydrogen projects, electrified steelmaking and other power-intensive activity. Cheap clean generation alone is not enough, however. Investors also look for grid connection speed, long-term power contracts, permitting certainty and stable policy signals.
The main constraints are grids, permits and demand growth
The global numbers are impressive, but they hide uneven regional progress. IRENA reported that China, the United States and the European Union together accounted for 550 GW, or 79.5%, of new renewable capacity installed in 2025. Africa accounted for 11.3 GW, or 1.6%. This imbalance matters because future electricity demand growth will be strongest in many emerging and developing economies that need affordable finance, stronger grids and bankable project pipelines.
Grid connection has become one of the most important bottlenecks. Clean power projects can often be planned faster than transmission lines can be approved and built. In some markets, long interconnection queues delay projects that are otherwise technically and financially ready. Distribution grids also need upgrades as rooftop solar, electric vehicles, heat pumps and local storage change power flows that were originally designed for one-way delivery from large central plants.
Permitting is another constraint. Wind farms, solar parks, transmission corridors, substations and storage sites all face land-use questions. Effective permitting reform does not mean removing environmental review or community input. It means setting clear timelines, improving coordination among agencies, identifying suitable zones early and ensuring that local communities see tangible benefits from projects. See also: EVs.
Demand growth is the third constraint. The IEA has repeatedly highlighted that electricity demand is growing faster than overall energy demand. That is a sign of electrification, but it also raises the bar for clean power. If demand from data centres, cooling, electric transport and industry rises faster than clean generation, fossil plants may run more often even while renewable capacity expands. The transition therefore depends on both supply growth and demand-side efficiency.
What the latest U.S. outlook suggests
The United States illustrates both momentum and complexity. In the September 2026 Short-Term Energy Outlook, the U.S. Energy Information Administration forecast that utility-scale solar generation would grow by 21% in 2026 and 18% in 2027, while wind generation would grow by 7% in 2026 and 5% in 2027. The same outlook showed that regional power demand and fuel competition still matter, with natural gas, coal, wind and solar playing different roles across grid regions.
This matters for companies and policymakers because a national clean power trend can look very different at the local level. A solar-rich region may need batteries and transmission. A wind-rich region may need stronger interregional links. A fast-growing data-centre hub may need firm capacity and faster grid interconnection. A coal-dependent region may need workforce planning, replacement tax revenue and reliability measures during plant retirements.
The practical lesson is that clean power energy is not only a generation issue. It is a system issue. The lowest-cost outcome usually requires coordinated planning across generation, storage, transmission, distribution, demand flexibility and market rules.
Signals to watch through 2030
Several indicators will show whether clean power energy is moving fast enough to reshape emissions, prices and energy security. The first is whether annual renewable additions keep rising or plateau after the record 2025 level. The second is whether grid investment accelerates at the same pace as generation investment. The third is whether storage moves from a supporting technology to a core reliability asset in high-renewable grids.
The fourth indicator is fossil generation in absolute terms. A rising share of clean electricity is positive, but emissions fall only when fossil generation and fuel use decline, or when remaining fossil plants are used less often and more efficiently. The fifth indicator is geographic distribution. If clean power growth remains concentrated in a few large markets, global progress will be slower and less equitable than headline capacity numbers suggest.
Finally, watch electricity prices during different hours of the day. More solar can reduce daytime prices, while evening peaks may remain expensive without storage or flexible demand. More wind can reduce seasonal fuel needs, but weak wind periods still require backup and regional balancing. These price patterns will influence power-purchase agreements, storage revenues, industrial siting and the economics of new generation.
Frequently asked questions
Is clean power energy the same as renewable energy?
Not exactly. Renewable energy includes sources that naturally replenish, such as solar, wind, hydropower, geothermal and sustainable bioenergy. Clean power energy is often used more broadly to mean low-emissions electricity. Depending on the source, it may include nuclear power and sometimes fossil generation with carbon capture, although definitions vary by policy and market context.
Why did 2025 become such an important year for clean power?
Public datasets released in 2026 show that 2025 brought record renewable capacity additions and major generation milestones. IRENA reported 692 GW of renewable capacity additions, while the IEA said renewables and nuclear grew enough to exceed the entire increase in global electricity generation. Ember reported that renewables overtook coal in global electricity generation for the first time in more than a century.
Does more clean power mean fossil fuels disappear quickly?
No. Clean power can reduce fossil generation, but the pace depends on electricity demand growth, grid capacity, storage, market design and retirement schedules for existing plants. Fossil generation can still rise in regions where demand grows faster than clean supply or where grids cannot absorb available renewable output.
What is the biggest barrier to faster clean power deployment?
The barrier is increasingly the power system around the projects rather than the generation technology alone. Transmission delays, interconnection queues, permitting complexity, financing costs, supply-chain constraints and insufficient storage can slow deployment even when solar and wind projects are economically attractive.
Why should businesses pay attention to clean power energy?
Businesses face changing power prices, new procurement options, stricter emissions expectations and growing competition for grid connections. Companies that understand clean power trends can better evaluate power-purchase agreements, site selection, resilience planning and long-term operating costs.