
What the latest global wind energy numbers show
Global wind energy entered 2026 with strong momentum, but the market is also harder to read than it was a few years ago. The Global Wind Energy Council reported that wind installations reached a record 165 GW in 2025, lifting global installed wind power to about 1,299 GW. The same report said wind power was operating in 138 countries, with China, the United States and India leading new capacity additions. For developers, utilities, equipment suppliers and power buyers, the message is practical: wind remains a core part of the energy transition, but growth now depends heavily on grid access, permitting speed, financing conditions and power-market design, not only on turbine demand. For related updates, see our wind energy coverage.
The wider power-market context is just as important. The International Energy Agency’s Global Energy Review 2026 said renewables supplied 34% of global electricity generation in 2025, up from 32% in 2024. Wind and solar together reached about 17% of global generation. Fossil fuels are still part of the power mix, but variable renewables have moved from a marginal planning issue to a central one for utilities, system operators and governments.
Wind’s 2025 performance should also be viewed alongside rapid solar growth. Solar PV added more capacity and generation than wind in many markets, but wind provides a different system value. In regions with strong night-time, seasonal or winter wind resources, wind can complement solar and reduce the amount of storage or backup capacity needed for a reliable low-carbon system.
Why wind is still expanding despite a tougher market
Several forces continue to support wind deployment. The first is electricity demand. The IEA estimated that global electricity demand rose by around 3% in 2025, adding roughly 800 TWh. Electrification, data centres, industry, cooling demand and transport are all increasing the need for additional power supply. Wind projects that can be permitted, financed and connected quickly help meet that demand without adding long-term fuel-price exposure.
Second, onshore wind remains cost competitive in many markets. IRENA’s Renewable Power Generation Costs in 2024 found that the global weighted average levelised cost of electricity for onshore wind was USD 0.034/kWh in 2024. IRENA also reported that onshore wind was 53% lower than fossil fuel-based generation on a global average basis for that year. These are global averages, not a guarantee for every project, but they help explain why utilities and corporate buyers continue to sign wind offtake contracts where resource quality, permitting and grid capacity are favourable.
Third, energy security has become a stronger policy argument. Wind energy uses a domestic resource and has no fuel-price exposure once operational. For countries with high fossil fuel import dependence, wind can be more than a decarbonisation tool. It can also help reduce exposure to gas and coal price volatility, especially when paired with transmission, storage and flexible demand.
The pressure points are clear. Higher interest rates, inflation in civil works, long grid queues and community opposition have made some projects harder to deliver. The global market is still growing, but it is no longer a simple story in which falling turbine prices automatically lead to faster deployment everywhere.
Where the buildout is happening
China remains the dominant driver of new renewable power capacity. The IEA’s Global Energy Review 2026 said China commissioned nearly 370 GW of solar PV and 117 GW of wind capacity in 2025. For wind, this reflects a combination of large onshore bases, manufacturing scale, grid planning and policy execution. China’s scale also influences global supply chains, including turbine components and rare earth magnets.
India is becoming more important, even though solar is currently expanding faster there than wind. The IEA reported that India’s wind additions doubled in 2025 to more than 6 GW. That increase matters because India needs a more diversified renewable generation mix to serve fast-growing demand and reduce pressure on coal generation. Wind resources in several Indian states can also complement solar output profiles.
The European Union presents a mixed picture. The IEA said EU onshore wind additions rose to about 13 GW in 2025, while offshore wind additions fell to around 1 GW. At the same time, wind and solar together supplied about 30% of EU electricity in 2025, surpassing fossil power for the first time in the bloc’s generation mix, according to IEA analysis. This highlights the difference between installed-capacity momentum and actual generation share. Europe already has a large wind fleet, but new offshore delivery has been slowed by costs, auctions and supply-chain pressure.
The United States remains one of the major wind markets, but policy and permitting uncertainty have weighed on the outlook. The IEA’s Renewables 2025 report revised the U.S. renewable growth forecast down sharply, citing policy changes including earlier tax credit phase-outs, import restrictions and constraints on new wind and solar permitting on federal land. That does not remove the existing U.S. wind base, but it does make the near-term project pipeline more uncertain.
| Indicator | Latest cited figure | Why it matters | Source basis |
|---|---|---|---|
| New global wind capacity | 165 GW in 2025 | Shows a record year for installations | GWEC Global Wind Report 2026 |
| Total installed wind power | About 1,299 GW in 2025 | Shows the size of the operating global fleet | GWEC Global Wind Report 2026 |
| China wind additions | About 117 GW in 2025 | Highlights China’s influence on global growth | IEA Global Energy Review 2026 |
| EU onshore wind additions | About 13 GW in 2025 | Shows steady onshore growth but weaker offshore delivery | IEA Global Energy Review 2026 |
| Onshore wind global LCOE | USD 0.034/kWh in 2024 | Explains continued economic demand for onshore projects | IRENA renewable cost data |
Onshore wind is leading while offshore wind is being reset
The strongest near-term growth is still expected to come from onshore wind. In its Renewables 2025 outlook, the IEA projected cumulative onshore wind additions of 732 GW over 2025-2030, a 45% increase compared with 2019-2024. Onshore projects are generally faster to develop than offshore wind, require less specialised marine infrastructure and can be built in a wider range of markets.
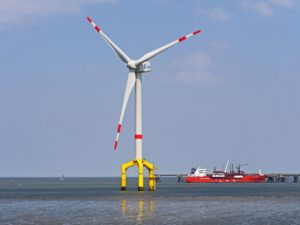
Offshore wind has a different role. It can deliver large volumes of power close to coastal demand centres and often has higher capacity factors than onshore projects. However, it is more exposed to interest rates, port constraints, vessel availability, seabed leasing, transmission planning and long development timelines. The IEA projected 140 GW of offshore wind capacity expansion over 2025-2030, with the annual market rising from 9.2 GW in 2024 to more than 37 GW by 2030. The agency also revised its global offshore wind forecast 27% lower than the previous year because of policy changes, rising costs, supply-chain challenges and project cancellations in several markets.
This reset does not mean offshore wind is failing. It means governments and developers are adjusting auctions, contracts and timelines to reflect actual project economics. Markets that align seabed rights, grid connections, inflation protection and port investment are more likely to keep offshore wind moving. Markets that treat offshore wind mainly as a headline target may struggle to convert ambition into commissioned capacity. See also: clean energy.
The next bottleneck is integration, not only turbine supply
Wind growth increasingly depends on whether power systems can absorb variable generation efficiently. Turbine availability still matters, but grid connections, transmission expansion, balancing markets and storage are becoming just as important. The IEA has warned that curtailment and negative power prices are rising in several markets as wind and solar shares increase faster than system flexibility.
Curtailment is not always a sign that wind has failed. It can indicate that renewable capacity is being built faster than grids, interconnectors, storage, demand response or market rules can adapt. At low levels, curtailment may be cheaper than overbuilding grids for rare peaks. At high levels, it weakens project revenue and can discourage investment. The practical question is not whether variable renewables can be integrated, but whether planning, market design and grid investment can keep pace with deployment.
Supply chains are another constraint. The IEA has noted that rare earth elements used in magnets for large onshore and offshore wind turbines are highly concentrated, with China dominant in mining, refining and magnet production. Diversification is possible, but it takes time because new mines, processing capacity and manufacturing plants require permitting, capital and technical expertise. This is why wind policy is increasingly linked to industrial strategy and mineral supply policy.
What to watch through 2030
The headline outlook remains positive. The IEA expects global wind capacity to nearly double to more than 2,000 GW by 2030, while also recognising supply-chain, permitting and financing challenges. It also expects wind and solar together to provide a much larger share of global electricity by the end of the decade. In the IEA’s Electricity 2026 outlook, solar PV and wind combined rise from 17% of global generation in 2025 to 27% by 2030.
For wind energy, the most useful indicators through 2030 will be practical rather than symbolic. Watch annual commissioned capacity rather than announced targets. Watch grid-connection queues, not only auction volumes. Watch whether offshore wind contracts include realistic inflation and financing assumptions. Watch whether onshore permitting reforms reduce lead times without weakening environmental review. Watch whether countries expand flexibility through storage, interconnectors, demand response and dispatchable low-carbon capacity.
The industry’s next phase will likely be uneven. China may continue to dominate additions, India and selected emerging markets may grow from a smaller base, Europe may strengthen onshore wind and repair offshore auction design, and the U.S. outlook may depend heavily on policy stability. The common theme is that wind is now a mainstream power source. That makes execution harder, because mainstream power sources must do more than add megawatts; they must support reliable, affordable and investable electricity systems.
Frequently asked questions
How much global wind energy capacity was added in 2025?
GWEC reported that 165 GW of new wind capacity was installed in 2025, which it described as a record year. Total installed global wind power reached about 1,299 GW by the end of the year.
Is onshore wind still cheaper than fossil fuel power?
On a global weighted average basis, IRENA’s 2024 cost data showed onshore wind at USD 0.034/kWh and 53% lower than fossil fuel-based generation. Actual project economics vary by country, wind resource, financing cost, grid connection and local permitting conditions.
Why is offshore wind facing more difficulty than onshore wind?
Offshore wind projects are larger, more capital intensive and more exposed to marine construction, ports, vessels, transmission planning and long development schedules. Rising costs and higher interest rates have made some previously awarded projects difficult to finance, leading to delays or contract resets in several markets.
Will wind power keep growing through 2030?
Current major forecasts suggest continued growth. The IEA expects global wind capacity to nearly double to more than 2,000 GW by 2030, but that outcome depends on faster permitting, stronger grids, supply-chain resilience and market rules that reward flexibility and reliability.
What is the main challenge for global wind energy now?
The main challenge is no longer demand for clean power alone. It is delivery. Wind projects need bankable contracts, timely permits, grid connections, community acceptance, balanced supply chains and power systems flexible enough to use more variable renewable generation efficiently.