

What solar power cost means in 2026
Solar power cost is not a single market price. For a U.S. homeowner, a practical 2026 planning range is often about $3.20-$4.20 per watt DC before incentives for a standard rooftop system. Competitive marketplace quotes can come in lower, while complex financed contracts, small projects, batteries, roof work, or electrical upgrades can push the effective price higher. At that range, an 8 kW system costs roughly $25,600-$33,600 before batteries, roof work, or electrical upgrades.
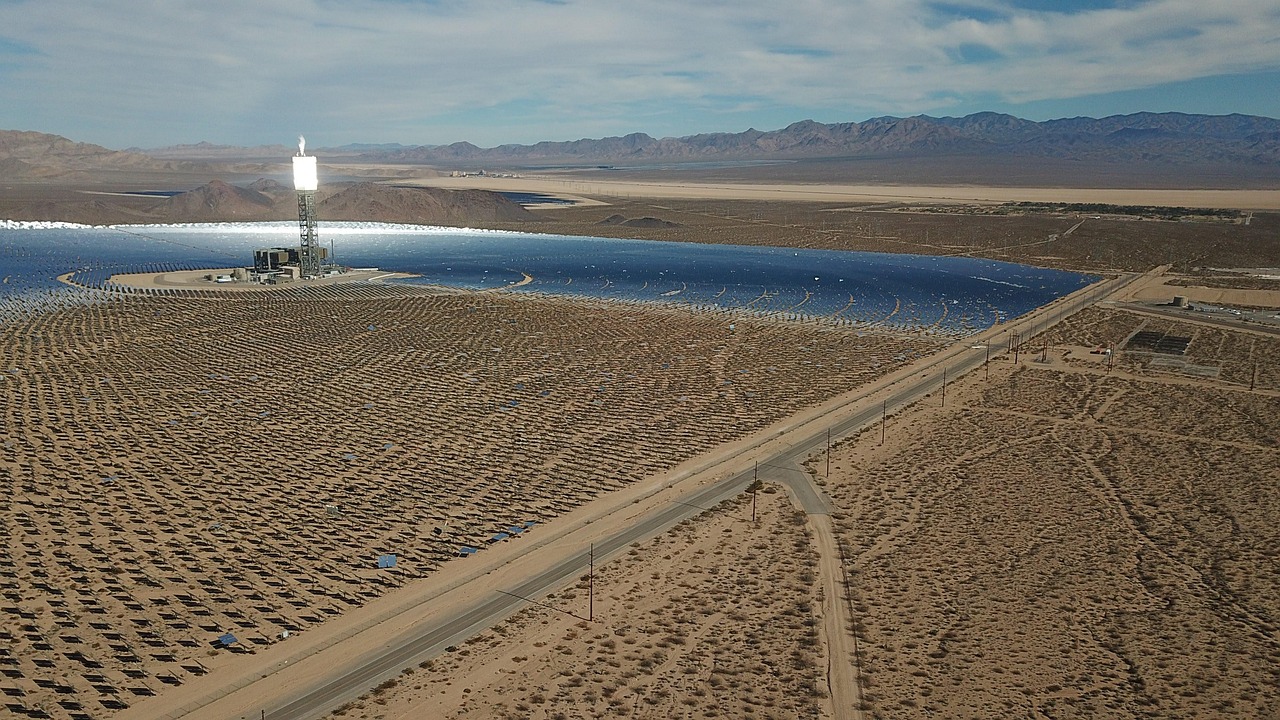
Utility-scale solar sits in a different cost category. The U.S. Department of Energy’s Fall 2025 industry update placed utility-scale PV around $1.10 per watt DC, reflecting the cost advantage of large projects. For homeowners, the bigger 2026 change is policy-related: according to IRS guidance, the federal residential clean energy credit is no longer available for expenditures made after December 31, 2025. That makes local electricity rates, state incentives, financing terms, and battery needs more important in the payback calculation.
In practice, solar power cost should be evaluated as total project economics, not panel price alone. The useful comparison is the cash price of the solar-only system, the added cost of batteries or required site work, the value of bill savings, and the contract terms if the system is financed.
Current solar cost benchmarks by segment
Public sources do not all measure solar cost the same way. DOE benchmarks model representative systems. Berkeley Lab’s Tracking the Sun reports observed prices for distributed systems. EnergySage reports marketplace quote data. SEIA and Wood Mackenzie track deployment and segment trends. These sources are complementary, but they are not interchangeable.
| Source or benchmark | What it measures | Recent figure to know | How to use it |
|---|---|---|---|
| DOE 2024 Q1 PV cost benchmark | Modeled representative systems in 2023 dollars | Residential rooftop PV modeled market price of $3.15/Wdc for an 8 kW system; utility-scale PV modeled market price of $1.12/Wdc for a 100 MW system | Useful for understanding system cost structure and why scale matters |
| DOE Fall 2025 Solar Industry Update | Modeled and reported U.S. PV pricing ranges | Residential solar at $3.20-$4.20/Wdc, nonresidential at $2.00-$3.60/Wdc, and utility-scale around $1.10/Wdc | Good for a current national planning range |
| Berkeley Lab Tracking the Sun 2024 | Reported prices paid for host-owned distributed PV through 2023 | Residential systems installed in 2023 showed a 20th to 80th percentile range of $3.20-$5.50/Wdc | Useful for understanding real-world variation by state, installer, and system design |
| EnergySage H1 2025 marketplace report | Quoted prices from a competitive residential solar marketplace | Median quoted solar price of $2.48/W in H1 2025 | Useful as a competitive quote reference, but not the same as the full installed-price market |
The main point is straightforward: low online quotes, national modeled benchmarks, and reported installed prices answer different questions. A low quote may be valid, but it may exclude roof work, battery backup, electrical upgrades, or financing charges. A reported installed price may include dealer fees or ancillary work. A modeled benchmark may not capture the site-specific items that appear on a final invoice.
Why residential solar costs more than utility-scale solar
The largest difference in solar power cost is between rooftop and utility-scale projects. A 100 MW solar farm spreads engineering, procurement, construction management, interconnection work, and equipment purchasing across a very large volume of watts. A home system carries small-project labor, local permitting, sales costs, truck rolls, roof constraints, and customer-specific design work.
DOE’s PV System Cost Model divides installed PV cost into modules, inverters, energy storage, structural balance of system, electrical balance of system, fieldwork, office work, and other developer costs. The first five categories are hardware-related. The last three are commonly treated as soft costs. That is why a decline in module prices does not reduce a rooftop quote dollar for dollar.
The module-price gap shows the issue clearly. DOE’s Fall 2025 update reported U.S. module prices around $0.27/Wdc in Q3 2025, while complete residential system prices were still several dollars per watt. Panels matter, but they are only one part of the installed system. Labor, inverters, racking, wiring, permits, customer acquisition, overhead, warranty reserves, and profit can account for much of the final price.
Berkeley Lab’s 2024 Tracking the Sun analysis also found wide price dispersion. State-level median residential installed prices for 2023 ranged from $3.20-$5.20/Wdc, and median prices across the top 100 residential installers ranged from $2.60-$5.90/Wdc after outliers were excluded. That spread is too large to explain by panel quality alone. Local market conditions, business models, financing practices, permitting, labor costs, and reporting methods all affect the number.
Battery storage, financing, and incentives can change the net price
Battery storage is the most common reason a solar quote rises above a solar-only benchmark. In DOE’s 2024 Q1 benchmark, residential PV-only had a modeled market price of $3.15/Wdc. An 8 kW residential PV system paired with a 13.5 kWh battery had a modeled market price of $5.19/Wdc. That does not mean every battery quote should match that figure, but it shows the order of magnitude: storage is a major cost adder, not a minor accessory.
Whether a battery improves the economics depends on the utility tariff. If exported solar is credited at or near the retail electricity rate, a battery may be primarily a resilience purchase. If export compensation is low or time-of-use prices are steep, storing afternoon solar for evening use can improve bill savings. Berkeley Lab reported that California’s transition from legacy net energy metering to the net billing tariff after April 15, 2023 helped drive much higher storage attachment under the new tariff structure.
Financing can be as important as hardware. Some solar loans advertise low monthly payments while embedding dealer fees or higher contract prices. Berkeley Lab notes that reported installed prices may include loan-financing fees passed through by installers. For a clean comparison, ask for three separate numbers: the solar-only cash price, the financed system price, and the total amount repaid over the loan term.
Incentives changed materially for U.S. homeowners in 2026. IRS guidance after Public Law 119-21 states that the residential clean energy credit is not allowed for expenditures made after December 31, 2025. State rebates, utility incentives, property-tax treatment, solar renewable energy certificates, and low-income programs may still matter, but they vary by location and should be verified before signing. Commercial and utility-scale projects face different tax-credit rules and timing requirements, so business buyers should model incentives separately from installed cost.
How to estimate payback from a solar quote
Simple payback starts with a basic formula: net project cost divided by annual bill savings. The challenge is estimating both inputs honestly. Net project cost should include solar equipment, installation, permitting, interconnection, electrical upgrades, battery equipment if selected, and any required roof work, minus confirmed incentives. Annual savings should reflect expected energy production, utility rate design, export credit rules, demand charges where applicable, and fixed charges that solar cannot offset.
For a screening example, consider an 8 kW residential system at $3.60/Wdc. The gross cost is $28,800. If the system produces 11,000 kWh in the first year and those kilowatt-hours are worth $0.182 each, close to EIA’s projected 2026 U.S. residential average, the first-year bill value would be about $2,000 before degradation, rate changes, export limitations, or fixed-charge effects. That implies a simple payback of roughly 14 to 15 years without incentives. In a high-rate state with strong self-consumption, payback may be shorter. In a low-rate state with low export compensation, it may be longer.
This is where national averages can mislead. A system in Arizona, Nevada, or Southern California can produce more electricity than the same-size system in a cloudy northern location, but tariff design may help or hurt the economics. A household with daytime consumption, an electric vehicle, a heat pump, or smart load control may use more solar on site, which can be more valuable than exporting power at a reduced credit.
For more background on technology and market developments, visit Econergy’s solar section.
A practical checklist for comparing solar quotes
- Compare the cash price first. Divide the solar-only cash price by the system’s DC watts. Do not mix battery, roof, or loan costs into this number unless every quote does the same.
- Separate adders. Ask for line items for battery storage, main-panel upgrades, trenching, roof repair, tree work, critter guards, extended warranties, and monitoring.
- Check the equipment, but do not overpay for branding alone. Module efficiency, inverter type, warranty terms, and racking quality matter, but they should be weighed against energy production and price.
- Review production assumptions. Compare estimated first-year kWh, panel orientation, shade losses, inverter loading ratio, and annual degradation. A cheaper system is not cheaper if production is overstated.
- Read the utility rules. Net metering, net billing, time-of-use rates, demand charges, fixed charges, and interconnection delays can change economics more than a small difference in panel price.
- Evaluate installer risk. Confirm licensing, insurance, workmanship warranty, service process, subcontractor use, and how roof penetrations are handled.
- Model ownership options carefully. Cash, loan, lease, and power purchase agreement structures allocate incentives, maintenance duties, risks, and long-term savings differently.
Treat any unusually low or high bid as a question, not an answer. A low bid may be efficient and competitive, or it may exclude work the project needs. A high bid may include valuable battery backup or difficult electrical work, or it may simply reflect higher sales and financing costs. The only reliable comparison is a normalized scope.
Frequently asked questions
Why do solar power cost estimates online disagree so much?
They often use different definitions. Some show quoted prices, some show modeled engineering benchmarks, and some show reported prices paid by customers. A quote may exclude upgrades; an installed-price data set may include financing fees; a benchmark may exclude project-specific complications. Always compare scope, system size, incentives, and financing.
What is a reasonable residential solar price per watt in 2026?
For planning, DOE’s recent U.S. range of about $3.20-$4.20/Wdc is a useful starting point for residential solar before incentives and adders. Competitive cash quotes may be lower, while financed projects, small systems, batteries, difficult roofs, or electrical upgrades can push the effective price higher.
Does adding a battery make solar cheaper?
Usually not on upfront cost. A battery increases project cost, but it may add backup power and can improve savings under time-of-use rates or low export compensation. The decision should be based on outage value, utility tariff, battery warranty, usable capacity, and expected cycling, not just the solar payback calculation.
Is utility-scale solar still cheaper than rooftop solar?
Yes, on a dollars-per-watt basis. Utility-scale projects benefit from procurement scale, standardized design, open land, and lower per-watt soft costs. Rooftop solar can still make financial sense because it offsets retail electricity bills, which are usually higher than wholesale generation costs.
How should I calculate my own solar payback?
Start with net cost, then divide by realistic annual bill savings. Use the solar-only cash price, add necessary upgrades, subtract confirmed incentives, and estimate production with local weather and shading. Then apply your utility’s actual rate plan and export-credit rules. If you are financing, evaluate total repayment, not only the first monthly payment.