
Clean and renewable energy has moved from a policy ambition into the center of electricity planning. As of September 2026, the major global datasets point in the same direction: solar and wind are setting deployment records, the IEA puts renewables at about 34% of global electricity generation, and battery storage is growing quickly enough to affect how grids manage variable power. This does not mean fossil fuels have disappeared. Coal and gas still supply a large share of electricity in many regions. The more practical shift is that new power-sector growth is increasingly being met by renewable technologies, supported by storage, grid investment, auctions and corporate procurement. For related coverage, visit our clean energy section.
What clean and renewable energy means in practice
The phrase clean and renewable energy is often used as if it describes one category, but it combines two related ideas. Renewable energy comes from sources that are replenished naturally, including solar, wind, hydropower, geothermal, bioenergy and marine energy. Clean energy is broader. It usually refers to technologies and systems that reduce air pollution and greenhouse gas emissions, which can include renewables, nuclear power, energy efficiency, electrification, storage and grid modernization.
This distinction matters because electricity systems are judged by more than one metric. A solar project may be renewable, low-emission and relatively fast to build, but it generates only when sunlight is available. Hydropower can provide flexible renewable electricity, yet output depends on water availability and may be constrained by drought, ecological rules or reservoir management. Bioenergy can be renewable under certain accounting rules, but its climate impact depends on feedstock, land use and combustion practices.
For investors, utilities and policy makers, the practical question is not simply whether a technology is labeled clean. The stronger test is whether it can deliver reliable electricity, reduce emissions, control costs and fit into the local grid.
What changed in the latest global data
The 2026 reporting cycle is important because it summarizes full-year 2025 results. The International Energy Agency, the International Renewable Energy Agency and Ember use different methodologies, but their findings point in the same direction: renewable capacity and generation continued to grow rapidly in 2025, with solar PV carrying much of the increase.
| Indicator | 2025 signal | Why it matters | Source noted in public reporting |
|---|---|---|---|
| New renewable capacity | IEA estimated about 800 GW of annual additions, while IRENA reported 692 GW of renewable capacity added. | Different accounting methods produce different totals, but both show a record year for renewable deployment. | IEA Global Energy Review 2026; IRENA Renewable Capacity Statistics 2026 |
| Total renewable capacity | IRENA reported 5,149 GW of renewable power capacity by the end of 2025. | Renewables are approaching half of global installed power capacity, even though generation share is lower because output varies by technology. | IRENA Renewable Capacity Statistics 2026 |
| Electricity generation share | IEA reported renewables at about 34% of global electricity generation in 2025, up from 32% in 2024. | Generation data show actual electricity delivered, not only equipment installed. | IEA Global Energy Review 2026 |
| Solar generation growth | IEA reported that solar PV generation rose by about 600 TWh in 2025. | Solar alone met a large share of the year’s increase in global electricity generation. | IEA Global Energy Review 2026 |
| Battery storage additions | IEA reported 108 GW of new battery storage capacity in 2025, around 40% more than in 2024. | Storage growth is becoming essential for integrating higher shares of solar and wind. | IEA Global Energy Review 2026 |
The table also highlights a common source of confusion. Capacity is not the same as generation. Capacity measures how much equipment is installed and technically able to produce power. Generation measures how much electricity is actually produced over time. Solar and wind can dominate new capacity additions while coal, gas, hydropower and nuclear remain important in annual generation because they have different operating patterns and capacity factors.
Solar is leading the expansion, but it cannot carry the transition alone
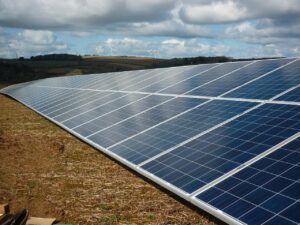
Solar PV is the most visible growth engine in clean and renewable energy. IRENA reported that solar accounted for roughly 510 GW of renewable capacity additions in 2025, while wind added about 159 GW. The IEA similarly found that solar made up about three-quarters of new renewable capacity additions in 2025. The reasons are practical: solar projects can be modular, equipment costs have fallen over the long term, and deployment can range from utility-scale plants to rooftop and commercial systems.
Solar’s strengths also create planning challenges. In grids with high midday solar output, electricity prices can fall sharply during sunny hours, while evening demand still requires storage, demand response, flexible generation or transmission from other regions. This is why solar deployment is increasingly tied to batteries, smart inverters, upgraded distribution networks and better forecasting.
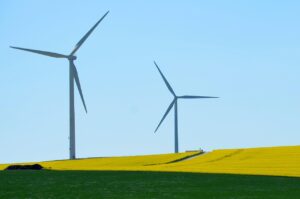
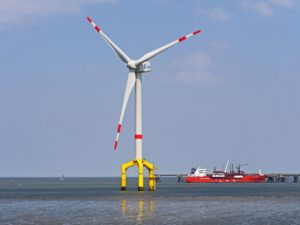
Wind power plays a different role. Onshore wind often produces strongly at times when solar output is low, depending on local weather patterns. Offshore wind can offer higher output and access to large coastal demand centers, although recent projects in several markets have faced cost inflation, supply-chain pressure and permitting complexity. Hydropower remains a major source of renewable electricity globally, but climate variability and environmental constraints limit how quickly it can expand. Geothermal and sustainable bioenergy can provide more dispatchable renewable power, yet they are highly location-specific and usually grow more slowly.
Costs are favorable, but project economics still vary
Cost competitiveness is one reason clean and renewable energy is expanding so quickly. IRENA’s 2026 cost reporting found that more than 90% of utility-scale renewable projects commissioned in 2025 produced power below the cost of the cheapest new fossil-fuel plant in their respective markets. Its reported global weighted-average levelized costs included USD 44 per megawatt-hour for solar PV, USD 33 per megawatt-hour for onshore wind and USD 78 per megawatt-hour for offshore wind.
Those figures are important, but they should not be read as a universal guarantee. Project economics depend on financing costs, land, permitting, interconnection queues, local labor, equipment pricing, curtailment risk and the value of electricity at the time it is delivered. A low-cost solar project that cannot connect to the grid on schedule is not low-risk. A wind project with strong resource quality can become difficult if transmission access is delayed or if contract prices no longer cover higher financing costs.
This is why renewable procurement is changing. Competitive auctions, corporate power purchase agreements and merchant-market exposure are becoming more common in many regions. The IEA has noted that auctions are now a major mechanism for utility-scale renewable deployment. In practice, developers must compete not only on technology cost, but also on bankability, grid access, delivery schedule and risk allocation.
The grid is becoming the main bottleneck
The next phase of clean and renewable energy growth depends less on whether solar panels and wind turbines can be manufactured, and more on whether power systems can absorb their output. Grid congestion, interconnection queues, curtailment and permitting delays are now central issues in mature and fast-growing markets.
Battery storage is one answer, especially for short-duration flexibility. According to the IEA’s 2026 review, around 80% of new battery capacity in 2025 was utility-scale, and China accounted for around 60% of global additions. Batteries can shift solar output into evening demand, provide frequency response, reduce congestion and improve the economics of renewable projects that would otherwise face curtailment.
Still, batteries are not a complete substitute for transmission, long-duration storage or broader system planning. Most grid batteries are designed for short-duration services, often around two to four hours. Seasonal balancing, multi-day weather events and industrial demand growth require a wider toolkit: transmission expansion, hydropower where available, geothermal, demand response, flexible loads, stronger regional power markets and, in some systems, low-emission firm capacity. See also: EVs.
What the shift means for energy markets and buyers
For electricity markets, the rise of renewables changes both investment signals and operating behavior. More zero-fuel-cost generation can reduce wholesale prices during high-output hours. At the same time, grids need greater value for flexibility, capacity, ancillary services and transmission access. This creates opportunities for batteries, flexible demand, advanced forecasting, grid software and hybrid projects that combine solar, wind and storage.
For corporate buyers, the lesson is to look beyond annual renewable energy claims. A company may match annual electricity use with renewable certificates, but its real emissions impact depends on location, timing and grid mix. More sophisticated procurement is moving toward hourly matching, additionality, storage-backed contracts and projects located on grids where clean generation can displace higher-emitting power.
For governments, the challenge is implementation. Nearly 200 countries supported the COP28 goal of tripling global renewable energy capacity and doubling the rate of energy efficiency improvements by 2030. Yet major agencies continue to warn that current policies and infrastructure are not enough to make the tripling target automatic. The gap is not mainly about technology availability. It is about permitting speed, grid buildout, finance access, supply-chain resilience and fair deployment across developing markets.
Risks and limits to watch in 2026
The growth story is strong, but several limits deserve attention. First, deployment remains uneven. IRENA reported that China, the United States and the European Union accounted for most new renewable capacity in 2025, while Africa represented a small share despite strong energy-access needs and improving project potential.
Second, electricity demand is rising. Data centers, electrified industry, cooling demand, electric vehicles and heat pumps can all increase power consumption. If demand grows faster than clean generation and grids can respond, fossil generation can remain high or even rise in some markets.
Third, local acceptance matters. Renewable projects need land, transmission corridors, ports, substations and community engagement. Poorly planned development can face opposition even when the technology is low-carbon.
Fourth, supply chains and financing conditions can change quickly. Higher interest rates, trade rules, equipment bottlenecks or policy uncertainty can delay projects. Clean and renewable energy is now cost-competitive in many settings, but it is not immune to macroeconomic pressure.
Frequently asked questions
Is clean energy the same as renewable energy?
No. Renewable energy comes from naturally replenished sources such as solar, wind, hydropower, geothermal, bioenergy and marine energy. Clean energy is a broader term that usually includes technologies and measures that reduce emissions or pollution, such as renewables, nuclear power, efficiency, storage and electrification.
Why do reports give different numbers for renewable growth?
Reports differ because they use different definitions, data cut-off dates and accounting methods. For example, one source may estimate annual additions before all country data are final, while another may report net capacity connected at the end of the calendar year. The important trend is consistent: 2025 was a record year for renewable deployment.
Does renewable capacity mean renewable electricity is available all the time?
No. Capacity measures installed equipment, while generation measures delivered electricity. Solar and wind output depends on weather and time of day. Reliable high-renewable systems require storage, transmission, forecasting, flexible demand and other resources that help match supply with demand.
Are renewables now cheaper than fossil fuels?
In many markets, new utility-scale solar and onshore wind are among the lowest-cost sources of new electricity. However, final project costs depend on financing, grid connection, land, permitting, curtailment risk and local market design. Cost leadership does not remove the need for careful system planning.
What is the most important clean and renewable energy trend to watch?
The most important trend is the link between renewable deployment and grid flexibility. Solar and wind growth remains central, but storage, transmission, demand response and market reform will determine how much clean electricity can be used effectively.