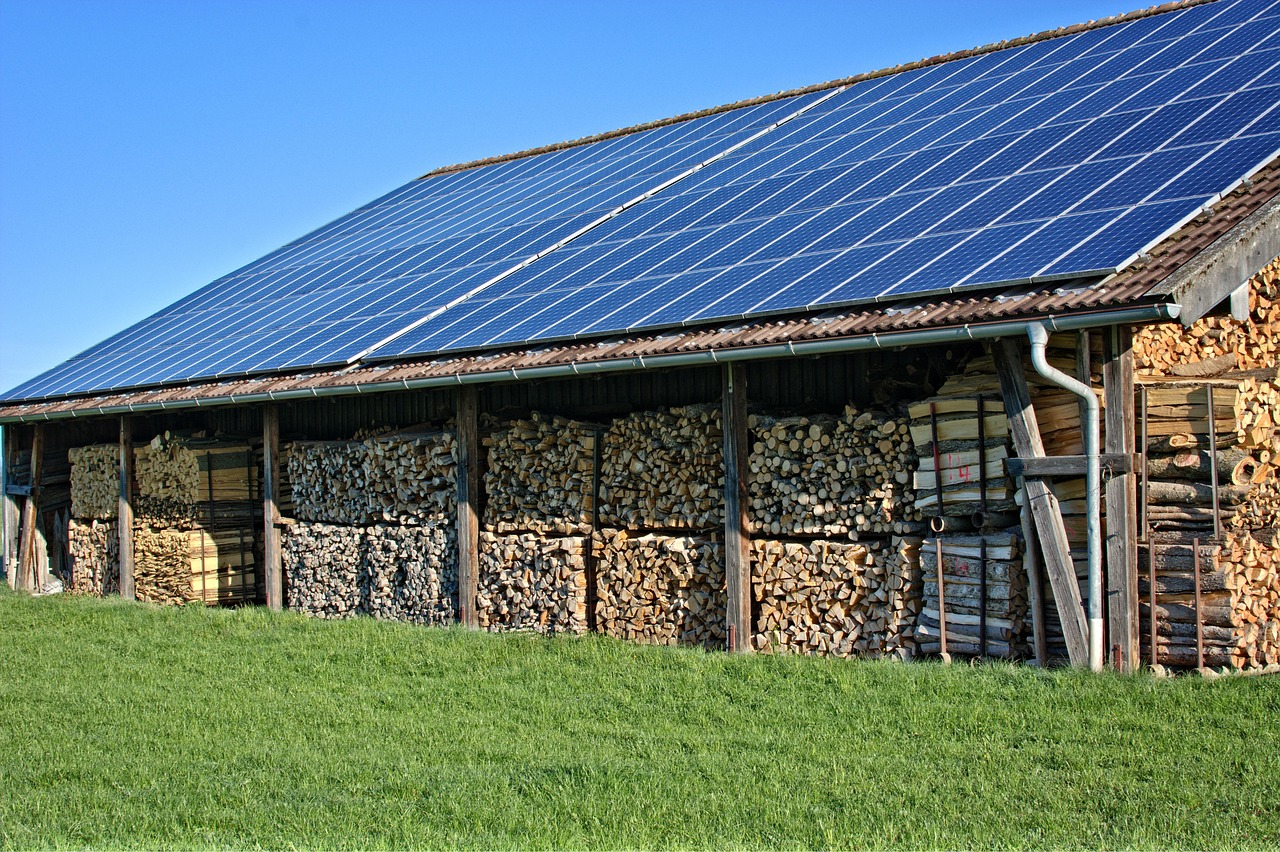

Energy and renewable energy now sit at the center of the same business question: how can economies meet rising demand while reducing exposure to fuel-price volatility, emissions and grid stress? Data for 2025, published in 2026, shows a clear shift in electricity. The International Energy Agency reported that renewables supplied 34% of global electricity in 2025, while low-emissions sources, including renewables and nuclear, reached 43%. Solar PV alone added about 600 TWh of generation, the largest annual increase ever recorded for that technology.
The broader energy system is moving more unevenly. Oil, gas and coal still play major roles in transport, heating, industry and power. The practical takeaway is clear: renewable power is scaling quickly, but the transition depends on grids, storage, demand flexibility, permitting and electrification, not generation capacity alone. For more clean power analysis, visit our clean energy section.
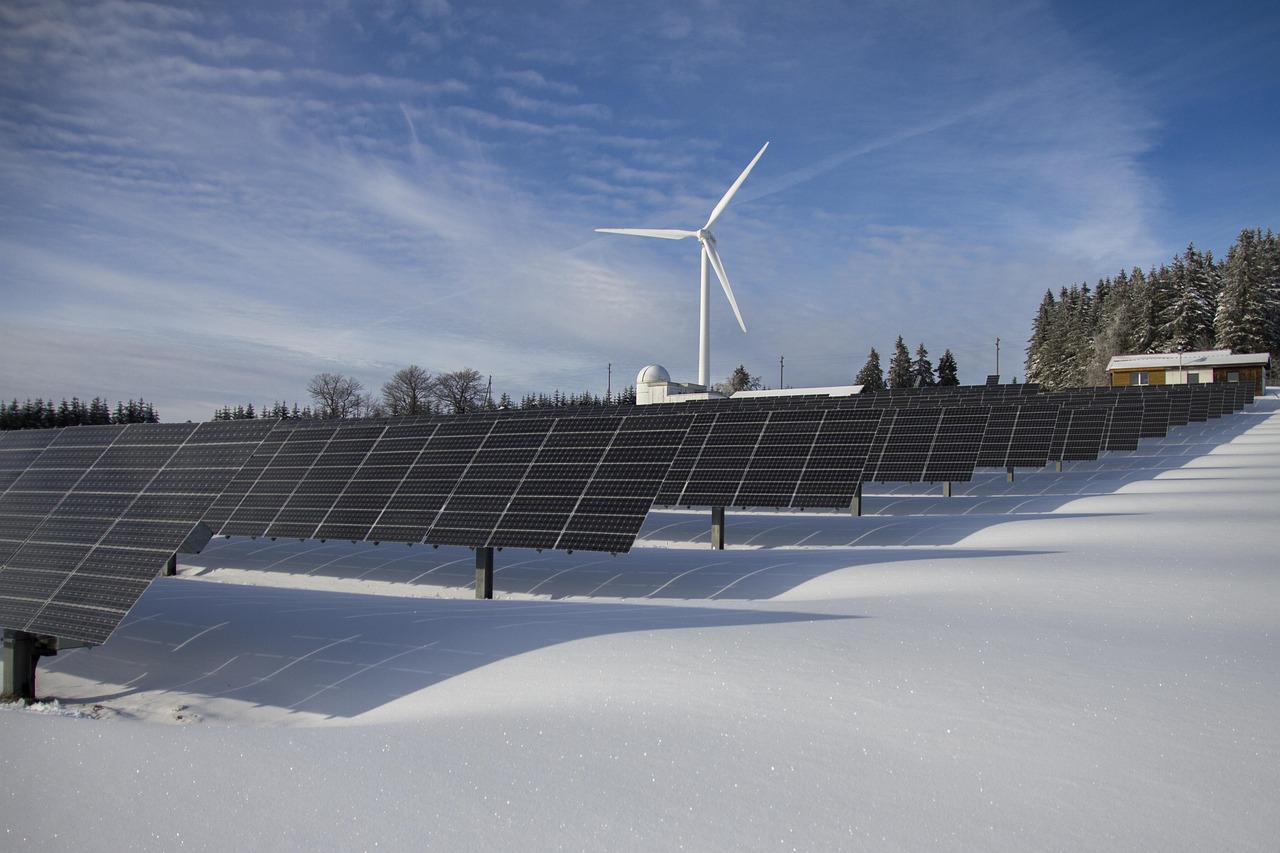
The practical difference between energy and renewable energy
Energy is the broad category. It includes electricity, heat, transport fuels, industrial process energy and the chemical feedstocks used in products such as fertilizers and plastics. Renewable energy is a narrower group of sources that are naturally replenished on human time scales, including solar, wind, hydropower, geothermal and some forms of sustainably managed bioenergy.
This distinction matters because many market headlines focus on electricity, while many emissions and fuel-security risks sit outside the power sector. A country may have a rapidly decarbonizing power grid and still rely heavily on oil in transport, gas in buildings or coal in heavy industry. That is why energy transition analysis should separate three concepts:
- Capacity: how much equipment can generate at maximum output, measured in GW.
- Generation: how much electricity is actually produced over time, measured in TWh or kWh.
- Final energy use: how households, transport, buildings and industry consume energy in real applications.
Renewable energy is advancing fastest in electricity because solar modules, wind turbines and battery systems can be manufactured and deployed at scale. The harder task is using cleaner electricity to replace fuel combustion in vehicles, boilers, industrial heat and some chemical processes.
What the latest data says about the power mix
The most useful 2026 view comes from comparing several source types rather than relying on one headline number. The International Energy Agency, the International Renewable Energy Agency, Ember and the U.S. Energy Information Administration each measure related but different parts of the system. Their figures do not always match exactly because definitions, reporting cutoffs, country coverage and estimates differ. Even so, they point in the same direction: renewable electricity is growing quickly, solar is leading new additions, and grids are becoming a critical constraint.
| Metric | Latest reported figure | Why it matters |
|---|---|---|
| Global electricity demand | IEA reported growth of nearly 3% in 2025 | Electricity is growing faster than total energy demand as data centers, buildings, industry and transport electrify. |
| Renewables share of global electricity | IEA reported 34% in 2025, up from 32% in 2024 | Renewables are no longer marginal in power markets; they are a core part of the global generation mix. |
| Wind and solar share | IEA reported 17% of global electricity in 2025 | Variable renewable energy is now large enough to shape grid operations, pricing and flexibility needs. |
| Solar PV generation growth | IEA reported an increase of about 600 TWh in 2025 | Solar became the largest single contributor to global electricity generation growth. |
| Renewable capacity additions | IEA estimated about 800 GW in 2025; IRENA reported 692 GW added to global renewable power capacity | Different datasets vary, but both indicate a record year for renewable expansion. |
| Battery storage additions | IEA reported almost 110 GW of new battery storage capacity in 2025 | Storage is moving from a supporting technology to a mainstream power-system tool. |
| U.S. utility-scale generation mix | EIA reported renewables at about 24% of U.S. utility-scale electricity generation in 2025 | Renewables are rising in the United States, while natural gas remained the largest source at about 41%. |
The comparison also carries an important caution. Capacity additions are not the same as delivered electricity. A GW of solar capacity does not produce the same annual electricity as a GW of nuclear, coal, gas, hydro or wind capacity because output depends on resource availability, operating hours and dispatch rules. A mature energy and renewable energy discussion therefore has to track both capacity and generation.
Why solar and wind are setting the pace
Solar and wind are leading new power investment because they combine modular manufacturing, relatively short construction timelines and improving economics. IRENA reported that in 2024, 91% of newly commissioned utility-scale renewable capacity delivered electricity at a lower levelized cost than the cheapest new fossil fuel-based alternative. It also reported global weighted average costs of USD 0.034/kWh for onshore wind, USD 0.043/kWh for solar PV and USD 0.057/kWh for hydropower.
Those figures do not mean every project is cheap or simple to execute. Financing costs, land access, permitting, interconnection queues, local labor constraints and supply-chain risks can change project economics. Offshore wind in particular has faced cost pressure in several markets. Solar can also face lower captured prices in regions where midday generation is abundant but storage and transmission are insufficient.
Even with those limitations, solar and wind have one advantage fossil fuel plants cannot replicate: once built, they do not need purchased fuel. That reduces exposure to international coal, oil and gas price volatility. For energy-importing countries, this has energy-security value as well as climate value. For companies, it can support long-term power procurement when contracts are structured carefully and matched with flexibility or storage.
The bottleneck is no longer only generation
The growth of renewable generation shifts the challenge from simply building power plants to operating a more flexible electricity system. In the early phase, adding wind and solar mostly displaced fuel use when the weather was favorable. At higher shares, the system needs transmission, distribution upgrades, storage, demand response and better market rules.
The IEA’s electricity grids analysis found that at least 3,000 GW of renewable power projects were waiting in grid connection queues, including 1,500 GW in advanced stages, based on available country data. The same analysis said global grid investment had remained around USD 300 billion per year and would need to nearly double by 2030 to meet national climate targets. It also estimated that more than 80 million kilometers of grids would need to be added or refurbished by 2040 to support national energy and climate goals.
This is why battery storage is becoming strategically important. Batteries do not create energy, but they shift electricity from one time to another, reduce curtailment, help manage evening peaks and provide fast grid services. Pumped hydropower, interregional transmission, flexible industrial loads, smart charging for electric vehicles and thermal storage can also provide flexibility. No single tool solves intermittency on its own. A portfolio of flexibility options is what allows higher renewable shares without sacrificing reliability.
What the shift means for companies, utilities and investors
For utilities, the main question is shifting from whether renewables can be built to how they can be integrated. Planning now has to coordinate generation, grid capacity, storage, forecasting, interconnection rules and customer-side flexibility. Utilities that treat transmission and distribution as passive infrastructure risk slower connections and higher congestion costs. See also: EVs.
For industrial companies, renewable procurement can reduce emissions and improve cost visibility, but only if buyers understand the contract structure. A corporate power purchase agreement does not automatically mean hourly clean electricity use. Annual matching, hourly matching, bundled renewable energy certificates and physical delivery all have different implications. Buyers should ask whether a contract reduces real fossil generation at the time and location of use, or mainly creates an accounting claim.
For investors, the opportunity is broader than solar farms and wind projects. Grid equipment, transformers, power electronics, battery systems, software, forecasting, advanced metering, thermal management and demand-response platforms all become more valuable as electricity demand grows. The IEA’s 2026 review noted that electricity demand grew much faster than overall energy demand in 2025. That reinforces a long-term investment theme: the energy system is becoming more electric, more digital and more dependent on infrastructure coordination.
For policymakers, the challenge is sequencing. Incentives for generation can succeed on paper while projects stall in connection queues. Permitting reform without grid planning can move bottlenecks from one agency to another. Renewable targets without storage, demand-side flexibility and market design can produce curtailment and public frustration. Effective policy links capacity targets with practical delivery mechanisms.
How to read renewable energy claims
Readers should treat sweeping claims about energy and renewable energy carefully. A claim that renewables are the cheapest option may be true for new utility-scale power in many markets, but it may not include transmission, balancing, storage or local financing costs. A claim that fossil generation is declining may refer to electricity only, not total fossil fuel consumption. A claim that a country has high renewable capacity may not mean renewable generation is equally high.
Use these checks when assessing a renewable energy statement:
- Check the unit: GW measures capacity; TWh measures actual generation; percentages need a defined denominator.
- Check the sector: electricity, total final energy, primary energy and transport fuels are not interchangeable.
- Check the date: 2024 cost data, 2025 generation data and 2030 forecasts answer different questions.
- Check the source type: official agencies, grid operators and statistical bodies are stronger sources for data than promotional summaries.
- Check system costs: low-cost generation still needs wires, storage, balancing and market design.
The balanced conclusion is that renewable energy is no longer a niche alternative. It is a major part of new power supply and a growing share of actual generation. The decisive phase, however, is system integration. Countries and companies that build clean generation without upgrading grids and flexibility will not capture the full value of the technology. Those that coordinate generation, storage, transmission and demand can reduce fuel risk while supporting a cleaner and more resilient power system.
Frequently asked questions
Is renewable energy the same as clean energy?
Not always. Renewable energy usually includes solar, wind, hydropower, geothermal and some bioenergy. Clean energy is often used more broadly and may include nuclear power or fossil generation with carbon capture, depending on the definition. For clear analysis, always check which sources are included.
Why do renewable capacity numbers differ between sources?
Capacity numbers can differ because organizations use different reporting schedules, country coverage, treatment of distributed solar, estimates for incomplete data and definitions of renewable technologies. If two credible sources report different figures, the trend may be more important than the exact number.
Can renewables power an electric grid reliably?
Yes, but reliability depends on system design. High-renewable grids need transmission, storage, flexible demand, forecasting, backup capacity and market rules that reward flexibility. The issue is not whether wind and solar can contribute, but how the whole system is planned and operated.
What is the biggest barrier to faster renewable growth?
In many markets, the barrier is shifting from technology cost to infrastructure and regulation. Grid connection queues, permitting delays, transformer supply constraints, local opposition and financing costs can slow projects even when solar or wind generation is economically attractive.
Why does the total energy transition move slower than renewable electricity?
Electricity is only one part of energy use. Transport, industrial heat, buildings and feedstocks often still rely on oil, gas and coal. Renewable electricity becomes more powerful when paired with electrification, efficiency and process changes in those sectors.