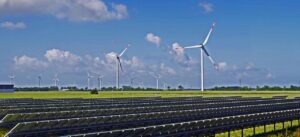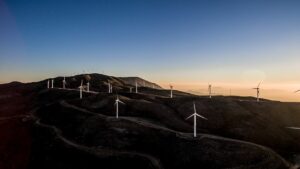

Clean energy production has become a core part of electricity supply rather than a policy-side add-on. In the latest full-year global datasets available in 2026, low-emissions electricity grew faster than total power demand in 2025, with solar providing the largest single increase. Fossil fuels have not disappeared: coal and gas still supply large shares of power in many markets. The change is that clean energy is now meeting a larger share of demand growth and influencing decisions on grid planning, storage, flexibility and transmission. For more coverage of this shift, visit our clean energy section.
What clean energy production means in practice
Clean energy production usually means producing useful energy with low or zero direct greenhouse gas emissions. In the power sector, it includes solar PV, wind, hydropower, geothermal, sustainably managed bioenergy, marine energy and nuclear power. Some organizations use “renewables” more narrowly and exclude nuclear. Others use “low-emissions electricity” to include both renewables and nuclear.
The distinction matters because power systems are measured in two different ways. Capacity shows how much equipment is installed, usually in gigawatts. Generation shows how much electricity is actually produced, usually in terawatt-hours. A solar farm, wind project, hydropower dam and nuclear plant can have very different annual output even if their installed capacity is similar. Weather, fuel availability, maintenance schedules, curtailment and grid congestion all affect real production.
Clean also does not mean impact-free. Solar and wind require land, materials and grid connections. Hydropower can affect rivers and ecosystems. Bioenergy depends heavily on feedstock sustainability. Nuclear requires strict safety, waste and financing frameworks. The practical objective is to build power systems that produce much more electricity with much lower emissions, while managing the environmental and operational trade-offs of each technology.
The 2025 data point to a structural shift
Several 2026 reports, including work from the International Energy Agency, Ember, IRENA and the U.S. Energy Information Administration, show the same broad pattern: clean electricity is expanding quickly, led by solar and wind, while regional results remain uneven.
| Indicator | Latest reported period | What it shows |
|---|---|---|
| Low-emissions share of global electricity | 2025 | The IEA reported that renewables plus nuclear reached about 43% of global electricity generation. |
| Renewables in global electricity | 2025 | Ember reported renewables at 33.8% of global generation, slightly ahead of coal in its dataset. |
| Wind and solar together | 2025 | The IEA reported wind and solar PV at about 17% of global electricity, up from roughly 5% a decade earlier. |
| Renewable capacity additions | 2025 | IRENA reported 692 GW of renewable capacity added, while the IEA estimated annual additions at around 800 GW using its own methodology. |
| U.S. utility-scale generation mix | 2025 | EIA data put U.S. utility-scale renewables at about 24%, nuclear at 18%, coal at 17% and natural gas at 41%. |
The gap between the IRENA and IEA capacity figures is a useful reminder that energy statistics often use different definitions, data cutoffs and estimation methods. IRENA’s Renewable Capacity Statistics 2026 reported total renewable power capacity of 5,149 GW after 692 GW of additions in 2025. The IEA’s Global Energy Review 2026 estimated renewable capacity additions at around 800 GW and noted that some regional figures were based on estimates where full-year data were not yet complete. Even with those differences, the direction of travel is consistent.
Solar is now the main source of incremental clean power
The biggest change in clean energy production is the speed of solar PV deployment. The IEA reported that global solar PV capacity additions surpassed 600 GW in 2025, bringing cumulative solar capacity to around 2,800 GW. It also noted that solar accounted for more than three-quarters of new renewable capacity additions worldwide.
Ember’s 2026 global electricity review found that solar generation rose by 636 TWh in 2025 to reach 2,778 TWh. In Ember’s analysis, solar alone met three-quarters of the net increase in global electricity demand that year. The IEA reported a similar scale of solar generation growth, at about 600 TWh, with roughly 55% of that increase taking place in China.
Solar’s role is changing because it is no longer only a daytime supplement in a few leading markets. It is becoming the default new-build power source in many regions, supported by modular construction, falling equipment costs and short development timelines. Rooftop systems, commercial installations and utility-scale plants all contribute to production, although grid operators often have better visibility over utility-scale assets than distributed solar.
The constraint is timing. Solar output peaks during daylight hours and drops quickly in the evening, which can create curtailment in sunny periods and tight supply during peak demand. Continued solar growth therefore depends not only on panels, but also on storage, transmission, demand response and market rules that reward flexibility.
Wind, hydro and nuclear still matter for a balanced clean mix
Solar is growing fastest, but clean energy production is broader than solar panels. Wind remains a major source of new power, especially in regions with strong onshore resources or offshore development pipelines. The IEA estimated global wind capacity additions at around 160 GW in 2025, a new record after slower growth in the previous year.
Hydropower remains the largest renewable electricity source in many systems, but its annual output can move sharply with rainfall, drought and reservoir conditions. That variability was visible in 2025, when weaker hydropower in parts of Europe and Eurasia moderated overall renewable generation growth even as solar continued to surge.
Nuclear power also remains significant in countries with large reactor fleets. The IEA reported that annual nuclear generation reached a record high in 2025, supported by reactor restarts in Japan, stronger performance in France and new units entering service in several countries. Nuclear is not renewable, but it is often included in low-emissions electricity because it produces large volumes of power with very low direct CO₂ emissions.
Geothermal, sustainable bioenergy, concentrated solar power and marine energy are smaller globally, but they can still have important local value. Their role is often strongest where they provide firm or dispatchable output that complements variable wind and solar.
Storage and grids are becoming part of production strategy
The next stage of clean energy production is not only about building more generators. It is about making clean electricity available when and where it is needed. Batteries are moving from a niche role in grid services to a central role in shifting solar output from midday to evening demand. Ember’s 2026 battery analysis estimated that battery additions installed in 2025 could shift about 18% of new daily solar generation into non-solar hours, with 2026 additions potentially raising that share further if deployment continues as expected.
Grids are the slower part of the equation. The IEA’s Electricity 2026 analysis noted that new transmission and distribution infrastructure can take five to fifteen years to plan, permit and complete, while solar and wind projects often move faster. This timing mismatch creates connection queues, curtailment and delayed clean energy production.
For developers and policymakers, the implication is practical: generation, storage, interconnection and market design need to be planned together. A low-cost solar plant that cannot connect to the grid, or that is frequently curtailed at midday, delivers less value than its headline capacity suggests. See also: EVs.
Regional patterns show progress and constraints
China remains the largest driver of global clean energy additions. In 2025, the IEA reported that China commissioned nearly 370 GW of solar PV and 117 GW of wind capacity. Strong growth in renewable and nuclear generation helped reduce coal-fired output, even as China’s electricity demand continued to grow more slowly than in 2024.
India also recorded rapid clean energy growth in 2025. The IEA reported almost 50 GW of solar PV additions and wind additions above 6 GW. Ember’s analysis found that record solar and wind generation, stronger hydro output and lower-than-average demand growth contributed to a decline in India’s fossil generation in 2025.
The European Union illustrates both momentum and weather risk. The IEA reported that solar PV and wind reached 30% of EU generation in 2025, surpassing fossil fuels for the first time. At the same time, weaker wind and hydropower output in parts of Europe increased the importance of gas-fired generation for system balancing.
The United States shows a different mix. EIA data for 2025 put utility-scale renewables at about 24% of generation, while natural gas remained the largest source at about 41%. Wind and solar together reached a record share, but coal generation rose from the previous year as fuel prices and market conditions shifted. This is why growth in clean energy production does not automatically mean fossil generation falls every year in every market.
Economics are improving, but local conditions decide outcomes
Cost is one reason clean energy production has scaled so quickly. IRENA’s 2026 cost report for 2025 found that solar PV remained around USD 44 per MWh, while onshore wind fell to about USD 33 per MWh and offshore wind to about USD 78 per MWh on a global weighted-average basis. These figures do not mean every project is low-cost. Financing costs, grid access, permitting timelines, local labor, supply chains and revenue certainty can change project economics substantially.
For electricity buyers, the relevant question is not only which technology has the lowest generation cost. It is whether the wider system can deliver reliable power at the time of use. A solar-plus-storage project, a wind portfolio connected across a wide region, hydropower flexibility, nuclear baseload and demand response can each contribute differently to reliability.
This is why the industry is moving from a narrow focus on megawatts installed to a broader focus on useful clean energy delivered. The strongest markets will be those that combine competitive generation with faster interconnection, transparent permitting, adequate storage and price signals that reward flexibility.
What to watch next
Clean energy production will likely be judged less by annual capacity records and more by its ability to displace fossil generation while meeting rising electricity demand from industry, buildings, electric vehicles, data centers and cooling. The most important indicators to track are:
- Generation share, not only capacity. Rising installed capacity matters, but actual output shows how much clean power is being delivered.
- Curtailment rates. Higher curtailment can signal that grids, storage or market rules are falling behind renewable growth.
- Battery duration and utilization. Storage value depends on whether batteries are placed and operated where they reduce system stress.
- Transmission buildout. Clean resources are often strongest far from demand centers, making grid expansion essential.
- Firm low-carbon supply. Nuclear, hydropower, geothermal, long-duration storage and other firm options can reduce reliance on fossil backup.
- Policy stability. Auctions, tax credits, permitting rules and grid tariffs can speed up or slow down investment.
The central takeaway is that clean energy production is entering a delivery phase. The technology base is expanding, costs are competitive in many markets and annual output is rising quickly. The main bottleneck is increasingly the power system around the generator: grids, storage, flexibility and market design.
Frequently asked questions
What is clean energy production?
Clean energy production is the generation of usable energy with low or zero direct greenhouse gas emissions. In electricity, it usually includes solar, wind, hydropower, geothermal, marine energy, sustainable bioenergy and often nuclear power when the focus is low-emissions generation.
Is clean energy the same as renewable energy?
Not exactly. Renewable energy comes from naturally replenished sources such as sunlight, wind, water flows and geothermal heat. Clean energy is a broader term that can include nuclear power because it produces electricity with very low direct carbon emissions, even though it is not renewable.
Why can renewable capacity grow faster than renewable generation?
Capacity measures installed equipment, while generation measures actual electricity output. Weather, maintenance, grid congestion, curtailment and capacity factors all affect how much electricity a project produces. This is why power system planning needs to consider both metrics.
What is the biggest bottleneck for clean energy production?
In many markets, the bottleneck is no longer technology cost alone. Grid connection delays, permitting, storage deployment, transmission capacity and market rules can limit how much clean electricity reaches consumers.
Will clean energy production replace fossil fuels soon?
Clean electricity is increasingly meeting demand growth, and in some markets it is reducing fossil generation. However, coal and gas still supply large shares of global power. The pace of replacement will depend on demand growth, grid investment, storage, firm low-carbon supply, policy stability and regional market conditions.