Renewable Energy Capacity Worldwide 2025, by Country
By 2025, global renewable energy capacity is projected to exceed 4,500 gigawatts (GW), driven by rapid solar and wind deployment across major economies. China, the United States, and India will remain the top three contributors in the list of renewable energy capacity, together accounting for more than half of total global installations. Policy-driven decarbonization in Europe and technological innovation in North America will further accelerate this shift. The year marks a pivotal point where renewables outpace fossil fuels in new power generation investments worldwide.
Overview of Global Renewable Energy Capacity in 2025
The global energy sector is undergoing its fastest transformation in decades. Renewables are not only expanding capacity but also reshaping how nations plan long-term energy security and economic growth.
Understanding the Global Renewable Energy Landscape
By 2025, total installed renewable capacity is expected to surpass all previous forecasts from international agencies such as IRENA and the IEA. This expansion stems from falling technology costs, government incentives, and corporate commitments to net-zero goals. Large-scale solar projects in Asia and offshore wind developments in Europe are setting new benchmarks for cost efficiency and scalability. Meanwhile, emerging economies are attracting record foreign direct investment into clean energy infrastructure.
Major Shifts in the Global Energy Mix
The transition from fossil fuels to renewables is no longer a theoretical ambition—it’s visible across national grids. Coal’s share continues to decline as countries retire aging plants and replace them with solar or wind installations. Technological innovation has reduced the levelized cost of electricity (LCOE) for renewables to below that of fossil-based generation in most regions. Developed economies lead in offshore wind and hydrogen integration, while developing nations focus on distributed solar systems that address rural electrification gaps.
Regional Distribution of Renewable Energy Capacity
Regional patterns reveal contrasting strategies shaped by geography, policy maturity, and industrial capability. While Asia-Pacific dominates growth volumes, Europe leads on policy coherence, and North America excels in innovation-led deployment.
Asia-Pacific: The Growth Engine of Renewables
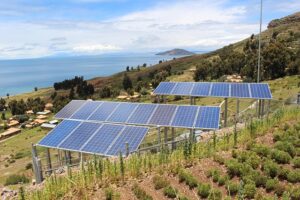
China remains unmatched in scale, accounting for nearly half of global renewable additions through vast solar farms in desert regions and offshore wind complexes along its eastern coast. Its hydropower assets continue to anchor grid stability during seasonal fluctuations. India’s ambitious national targets under programs like “Renewable Energy Mission 2030” have triggered rapid solar park development across Rajasthan and Gujarat. In Southeast Asia, nations such as Indonesia and the Philippines diversify into biomass and geothermal energy to reduce import dependency while ensuring baseload reliability.
Europe: Decarbonization Through Policy Integration
Europe’s progress toward its 2030 climate goals underscores how coordinated regulation drives tangible outcomes. The EU Emissions Trading System (ETS) incentivizes carbon reduction while member states expand renewable auctions. Germany leads with onshore wind repowering projects; Spain accelerates photovoltaic expansion; the UK advances offshore wind farms that now deliver record low strike prices per megawatt hour (MWh). Eastern European countries like Poland are emerging players through hybrid wind-solar portfolios supported by EU structural funds.
North America: Technological Innovation and Market Dynamics
In North America, diverse market frameworks shape renewable trajectories. The United States combines federal tax credits with state-level renewable portfolio standards (RPS), fostering both utility-scale solar arrays in Texas and offshore wind hubs along the Atlantic coast. Canada continues to rely heavily on hydropower but is expanding its wind sector across Alberta and Saskatchewan. Mexico’s evolving regulatory reforms aim to balance private participation with national grid modernization as it integrates more intermittent sources.
Country-Level Insights from the List of Renewable Energy Capacity 2025
Country-level data provide a granular view of leadership trends within the list of renewable energy capacity rankings for 2025.
Leading Countries by Installed Capacity
China
China’s total renewable capacity is projected to exceed 1,400 GW by 2025—more than double that of any other nation. Its strategy integrates massive solar base construction with advanced transmission corridors linking western resource zones to eastern demand centers. Offshore wind expansion near Jiangsu Province complements large hydropower reservoirs like Three Gorges for flexible dispatching.
United States
The United States’ growth trajectory benefits from production tax credits (PTC) and investment tax credits (ITC) extended through federal legislation. Private capital continues flowing into utility-scale solar farms exceeding hundreds of megawatts each, alongside emerging offshore projects off New York and Massachusetts coasts that strengthen coastal grid resilience.
India
India’s government-backed schemes such as “PM-KUSUM” promote decentralized solar adoption among farmers while large industrial parks integrate battery storage pilots to stabilize supply variability. However, grid congestion remains a challenge requiring advanced forecasting tools and regional interconnection upgrades.
Emerging Markets with Rapid Growth Potential
Brazil
Brazil maintains hydropower as its backbone but diversifies into wind corridors along its northeastern coastline where high capacity factors reach over 45%. Solar installations near São Paulo further balance hydro seasonality during drought years.
Middle East Countries (Saudi Arabia, UAE)
Saudi Arabia’s Vision 2030 strategy repositions it as a clean energy innovator through giga-projects like NEOM’s integrated hydrogen-solar complex. The UAE continues leading regional adoption via large-scale PV facilities such as Al Dhafra Solar Park exceeding two gigawatts capacity—transforming traditional oil economies into diversified power exporters.
Technological Composition of Global Renewable Capacity 2025
Technology composition defines not only installed capacity but also system reliability profiles across continents.
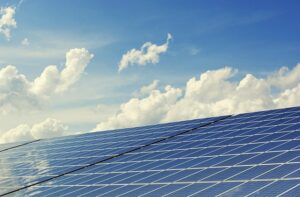
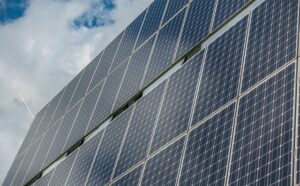
Solar Power as a Central Pillar of Expansion
Solar PV remains the fastest-growing technology due to continuous cost declines below $0.02 per kWh in competitive tenders worldwide. Floating photovoltaic systems deployed on reservoirs optimize land use while bifacial modules capture reflected light for higher yields—particularly effective in desert or snow-covered terrains.
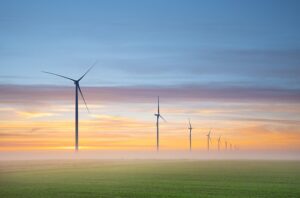
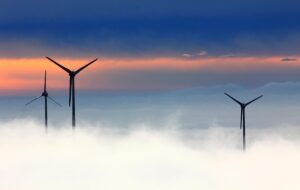
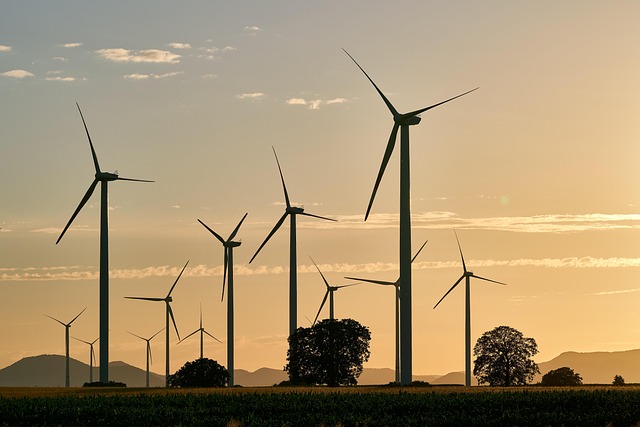
Wind Energy’s Expanding Role Across Continents
Offshore wind becomes increasingly central for coastal nations pursuing high-density power solutions without land constraints. Turbine designs now exceed 15 MW per unit output with improved blade aerodynamics enhancing annual energy production efficiency by up to 20%. Onshore repowering also extends asset lifespans at reduced capital intensity.
Hydropower, Biomass, and Geothermal Contributions
Hydropower retains relevance through modernization rather than new dam construction—digital monitoring improves operational flexibility during peak demand periods. Biomass facilities convert agricultural residues into combined heat-and-power outputs supporting circular economy goals. Geothermal developments gain traction across volcanic belts like East Africa Rift Valley providing stable baseload generation unaffected by weather variability.
Factors Influencing the 2025 Renewable Energy Rankings by Country
The relative ranking among nations depends on policy coherence, financial access, infrastructure readiness, and manufacturing ecosystems.
Policy Frameworks and Investment Climate
Countries offering predictable tariffs or auction mechanisms attract consistent investor confidence. Carbon pricing instruments internalize environmental costs while multilateral banks finance cross-border interconnections essential for balancing variable generation flows between markets.
Grid Infrastructure and Storage Integration
Smart grids equipped with digital sensors manage fluctuating supply-demand dynamics efficiently. Battery storage systems—from lithium-ion arrays to flow batteries—enable time-shifting capabilities vital for maintaining grid stability especially during evening peaks when solar output declines sharply.
Technological Transfer and Local Manufacturing Capacity
Domestic production lines lower equipment costs while fostering job creation within local industries. Collaborative ventures between global turbine or module manufacturers and regional suppliers accelerate deployment timelines without compromising technical standards or quality assurance benchmarks defined by IEC or ISO norms.
Future Outlook: Post‑2025 Trends in Global Renewable Development
Beyond 2025, momentum continues toward deeper electrification supported by hybrid systems combining renewables with emerging vectors like green hydrogen.
Anticipated Shifts Beyond 2025
Africa’s untapped solar potential positions it as the next frontier for scalable clean generation projects backed by international financing guarantees. Asia-Pacific economies expand integrated storage-hydrogen clusters linking industrial decarbonization pathways with export-oriented value chains built around ammonia or synthetic fuels derived from renewable electricity inputs.
Strategic Implications for Policymakers and Industry Stakeholders
Governments must adapt regulatory frameworks quickly enough to accommodate fast-moving technologies without stalling private investment cycles. Cross-border cooperation through shared transmission corridors or regional balancing markets enhances overall system resilience while advancing collective decarbonization objectives aligned with Paris Agreement trajectories.
FAQ
Q1: Which country will have the largest renewable energy capacity by 2025?
A: China will lead globally with an estimated total exceeding 1,400 GW across solar, wind, and hydro segments combined.
Q2: How significant is solar power compared with other technologies?
A: Solar represents nearly half of all new additions due to record-low costs per kilowatt hour achieved through scale manufacturing improvements.
Q3: What role does policy play in shaping national rankings?
A: Stable incentives such as feed-in tariffs or competitive auctions directly influence investor confidence determining project pipeline continuity.
Q4: Are emerging markets catching up rapidly?
A: Yes, nations like Brazil, Vietnam, and Saudi Arabia demonstrate double-digit annual growth rates driven by favorable financing conditions and resource availability.
Q5: What challenges remain after 2025?
A: Key issues include grid modernization delays, raw material supply constraints for battery production, and ensuring equitable access across developing regions despite uneven capital flows.