
Wind turbine power generation in brief
Wind turbine power generation converts moving air into electricity through aerodynamic lift, rotor rotation and a generator. For grid planners, investors and energy readers, the central issue is not simply whether a turbine can produce power. It is how much useful electricity it can deliver at a specific site, during specific hours, through a specific grid connection.
Recent public reports from the International Energy Agency, Ember, the Global Wind Energy Council, the U.S. Department of Energy and Lazard point to the same practical conclusion: wind is a mature, scalable power source, but its value depends on wind resource quality, turbine design, interconnection, forecasting and system flexibility. For related updates, see our wind energy coverage.
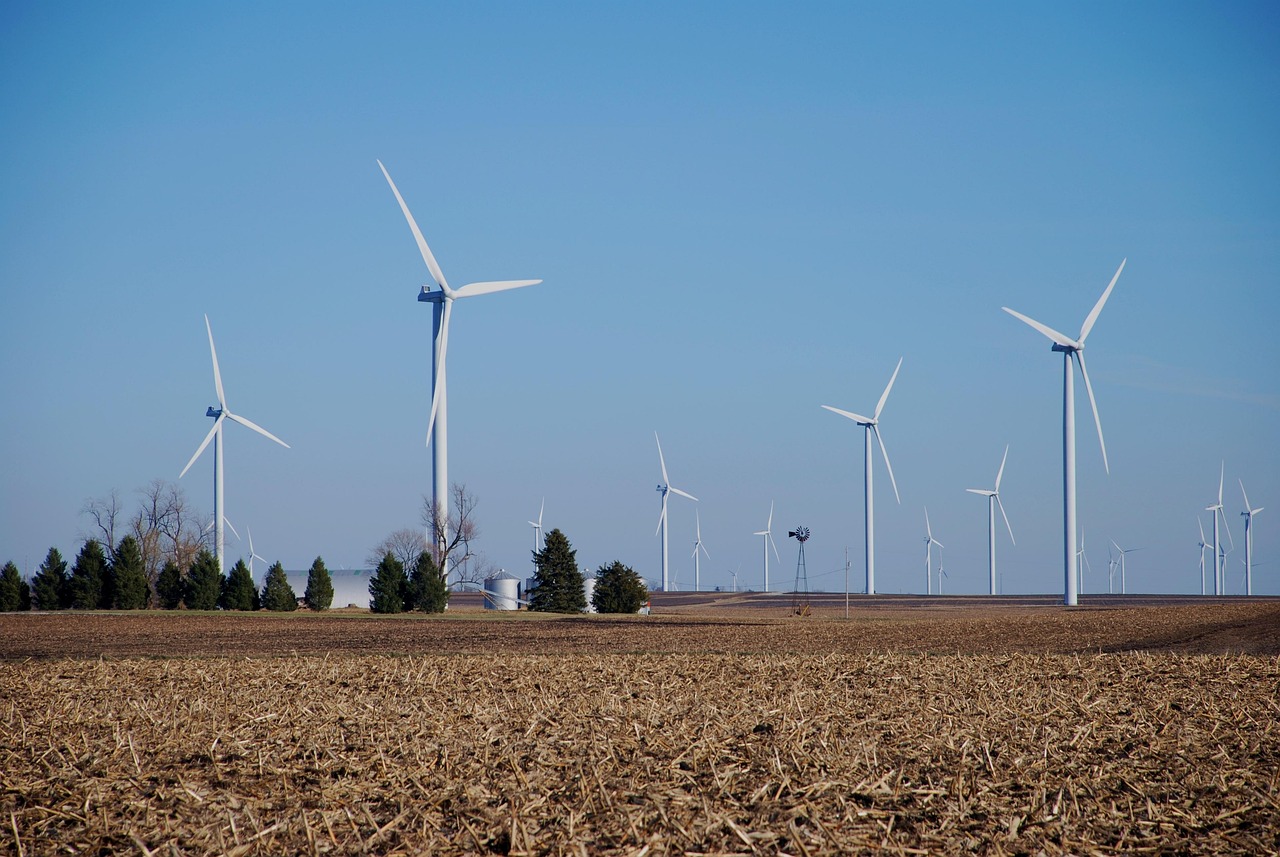
This article explains the technology, market numbers and grid issues behind modern wind generation without treating capacity, generation and reliability as the same thing.
How a wind turbine turns wind into electricity
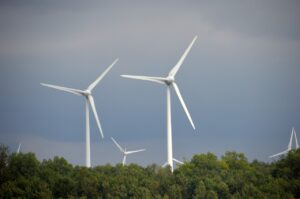
A modern wind turbine is not a fan running backward in a simple mechanical sense, but the comparison is useful. Wind moving across the blades creates aerodynamic lift, similar to the lift on an aircraft wing. That lift turns the rotor. The rotor transfers mechanical energy through a main shaft to a generator, either directly or through a gearbox, depending on the turbine design. The generator produces electricity, which is conditioned by power electronics and stepped up through transformers before entering a wind plant collection system and then the wider grid.
Several components determine how efficiently and reliably this process works. The blades capture energy from the wind. The nacelle houses major drivetrain and control equipment. The tower raises the rotor into stronger and less turbulent wind. Pitch controls adjust blade angle to manage output and protect the machine. The yaw system keeps the rotor aligned with changing wind direction. Sensors, software and power converters help the turbine operate safely across a wide range of conditions.
Why wind speed matters so much
The energy available in wind rises roughly with the cube of wind speed. In practice, a modest increase in wind speed can produce a large increase in available power, up to the turbine’s rated operating range. This is why site selection, hub height and long-term wind measurement are so important. A taller tower can place the rotor in stronger winds, but it also increases engineering, transportation and installation requirements. A larger rotor can sweep more area, but it must be matched with the drivetrain, tower and local wind conditions.
A turbine does not generate at full rated power all the time. Below its cut-in range, wind is too weak to operate economically. In the middle of the power curve, output rises as wind speed increases. Once the turbine reaches rated power, controls limit additional output to protect equipment. At very high wind speeds, turbines may shut down for safety. This operating pattern is the basis for understanding capacity factor.
Capacity, generation and capacity factor are different metrics
Installed capacity measures the maximum output a turbine or wind farm can deliver under rated conditions. Electricity generation measures the actual energy delivered over time, usually in megawatt-hours or terawatt-hours. Capacity factor connects the two by comparing actual output with the energy that would have been produced if the asset ran at full rated power every hour.
Annual energy output = rated capacity × 8,760 hours × capacity factor. For example, a 5 MW turbine with a 40% capacity factor would produce about 17,520 MWh in a year. That is not a universal production estimate; it is a transparent calculation showing how the metric works. The real number depends on the local wind regime, turbine availability, wake effects, curtailment, maintenance, grid constraints and environmental operating limits.
| Metric | What it means | Why it matters |
|---|---|---|
| Rated capacity | Maximum designed output under specified conditions | Useful for sizing equipment and comparing project scale |
| Electricity generation | Actual energy delivered over a period | Determines how much demand the project helps serve |
| Capacity factor | Actual generation divided by theoretical full-power generation | Shows how effectively the asset converts installed capacity into energy |
| Grid value | Economic and operational value at the time and place of delivery | Can differ from annual generation because power prices and grid needs vary hourly |
This distinction avoids a common misunderstanding. A 100 MW wind farm and a 100 MW gas turbine do not support the grid in the same operating pattern. The wind farm has no fuel cost and low operating emissions, but its output varies with weather. Dispatchable plants, storage, transmission, demand response and regional diversity help balance that variability.
What recent data says about wind in the power mix
Public energy datasets show that wind has moved from a niche renewable source to a material part of modern power systems. The Global Wind Energy Council’s 2026 report, covering 2025 installations, said the industry installed 165 GW of new wind capacity worldwide in 2025 and reached about 1,299 GW of global installed wind power. The same report identified China, the United States and India as leading markets for new additions, reflecting the continued dominance of onshore wind in annual deployment.
The International Energy Agency’s Global Energy Review 2026 estimated that renewables supplied 34% of global electricity generation in 2025, while wind and solar PV together reached 17%. Coal and gas remained major sources at about 34% and 21% respectively, which shows both the scale of clean electricity growth and the size of the fossil generation base still to be displaced. Ember’s Global Electricity Review 2026 similarly found that renewables exceeded one third of global power generation in 2025 and that fossil generation edged down slightly year over year.
| Source and period | Key signal | Interpretation |
|---|---|---|
| GWEC Global Wind Report 2026, covering 2025 | 165 GW of new wind capacity and about 1,299 GW installed globally | Wind deployment is still expanding at utility scale |
| IEA Global Energy Review 2026, 2025 data | Renewables at 34% of global electricity; wind and solar together at 17% | Wind is part of a broader variable renewable shift, not a standalone transition |
| IEA Renewables 2026 outlook | Renewables projected to rise toward 43% of global electricity by 2031, with wind and solar driving most growth | Grid planning, flexibility and transmission become central constraints |
| Lazard LCOE+ June 2025 | Onshore wind estimated at $37 to $86 per MWh in its U.S. unsubsidized analysis | Wind can be cost competitive, but LCOE does not capture every grid value or risk |
These sources are not identical because they measure different things: capacity, generation, cost estimates and future outlooks. The useful insight comes from comparing them carefully. Capacity shows how much equipment has been built. Generation shows how much electricity was produced. Cost estimates describe project economics under specific assumptions. Forecasts show expected direction, but they can change with permitting, commodity prices, interest rates, grid bottlenecks and policy design.
Onshore and offshore wind generation follow different economics
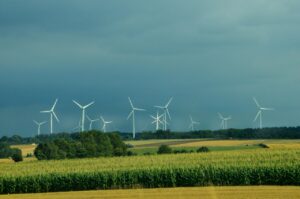
Onshore wind remains the workhorse of global wind turbine power generation. It benefits from mature supply chains, established construction methods and easier access for operation and maintenance. Good onshore sites can deliver low-cost electricity, especially where transmission is available and permitting is predictable. The constraints are also familiar: land use, local acceptance, wildlife considerations, radar or aviation rules, road access for large components and congestion on the grid.
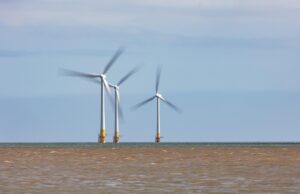
Offshore wind offers a different value proposition. Offshore sites can have stronger and more consistent wind resources, and turbines can be much larger because blades, towers and nacelles can be moved by vessel rather than truck. Offshore projects can also deliver power near coastal load centers where land is limited. However, offshore wind usually faces higher capital costs, specialized vessel requirements, port upgrades, marine construction risk, undersea cable complexity and longer development timelines. That is why offshore wind can be strategically important without being automatically cheaper or easier than onshore wind.
For readers comparing the two, the practical question is not which technology is better in the abstract. It is which resource fits the grid need, permitting environment, supply chain and offtake structure. A well-sited onshore project with a strong interconnection may be more valuable than a delayed offshore project. In another region, offshore wind may provide generation during high-demand hours and relieve land constraints. Context decides the answer. See also: clean energy.
How wind affects grid planning
Wind generation changes how power systems are planned and operated because its output is variable but increasingly forecastable. Grid operators use weather models, plant-level telemetry and regional aggregation to predict output. Forecasting does not make wind dispatchable in the same way as a gas turbine, but it reduces uncertainty and helps operators schedule reserves, transmission flows and market dispatch.
Transmission is often the decisive factor. The best wind resources are not always close to the largest demand centers. When transmission is insufficient, wind plants can be curtailed even when turbines are available and wind is strong. Curtailment is not always a sign that wind is failing; it can indicate that grid expansion, storage, flexible demand or market design has not kept pace with generation build-out.
Modern wind plants can also provide grid services when equipment and interconnection rules allow. Power electronics can support voltage control, reactive power management and frequency response. Some turbines can provide synthetic inertia or fast active power response, although actual performance depends on technical settings and grid code requirements. These capabilities matter more as synchronous thermal generators retire and inverter-based resources provide a larger share of electricity.
Storage is helpful, but it is not required at every wind project. Batteries can reduce curtailment, smooth short-term output, shift energy into higher-value hours and provide ancillary services. Long-duration storage, expanded transmission, hydropower flexibility, demand response and regional market coordination can all complement wind. The right portfolio depends on local load patterns and weather diversity.
What determines a high-value wind project
A high-value wind project is not defined only by turbine size. It starts with a bankable wind resource assessment using long-term measurements and validated models. It needs a turbine suited to site turbulence, air density, temperature, icing risk, terrain and grid requirements. It also needs realistic estimates for availability, wake losses, electrical losses, environmental constraints and curtailment.
Interconnection quality can be as important as the wind resource itself. A strong wind site with a weak grid connection may face delays, upgrade costs or curtailment. A moderate wind site near demand, with available grid capacity and supportive local permitting, may produce better risk-adjusted value. Developers and policymakers therefore need to evaluate wind power as an electricity system asset, not just as a collection of turbines.
- Resource quality: wind speed, wind direction, turbulence, seasonal profile and extreme weather risk.
- Technology fit: rotor diameter, hub height, drivetrain choice, controls and cold or hot climate packages where needed.
- Grid access: interconnection timing, upgrade costs, congestion risk and curtailment exposure.
- Commercial structure: power purchase agreements, auctions, merchant exposure, balancing costs and policy incentives.
- Community and environmental factors: local engagement, landowner agreements, wildlife mitigation and transparent benefit sharing.
The next phase of wind growth will be judged less by headline turbine size and more by delivery: dependable electricity, timely grid connections and public trust. That is where engineering, market design and community engagement meet.
Frequently asked questions
How much electricity can one wind turbine generate?
It depends on rated capacity, wind conditions, turbine availability and capacity factor. A simple estimate is rated capacity multiplied by 8,760 hours and then by the expected capacity factor. For example, a 5 MW turbine at a 40% capacity factor would produce about 17,520 MWh per year, but real projects need site-specific modeling.
Is wind turbine power generation reliable?
An individual turbine is variable because wind changes, but a fleet of turbines spread across regions becomes more predictable. Reliability comes from forecasting, transmission, flexible generation, storage, demand response and market rules that balance supply and demand every hour.
What is the difference between wind capacity and wind generation?
Capacity is the maximum rated output of turbines or a wind farm. Generation is the actual electricity produced over time. A country can add a large amount of wind capacity, but annual generation will depend on wind conditions, turbine performance, grid availability and curtailment.
Is offshore wind always better than onshore wind?
No. Offshore wind can access strong marine winds and use very large turbines, but it usually has higher construction and maintenance complexity. Onshore wind is often cheaper and faster to build where land, permits and transmission are available. The better option depends on local system needs.
What limits wind power growth the most?
The main constraints are often permitting, grid connection delays, transmission bottlenecks, supply chain pressure, financing costs and community acceptance. Turbine technology continues to improve, but system integration determines how much of that potential becomes useful electricity.